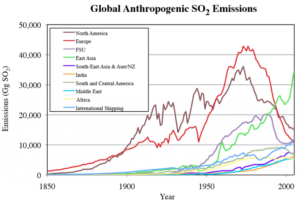
Anthropogenic emissions of SO2 into the troposphere peaked during year 1972 at about 131 Megatonnes. By year 2000, due to worldwide Clean Air Act efforts, SO2 emissions in the West had decreased by approximately 48 Megatonnes. However, during the same time period, emissions elsewhere rose by 23 Megatonnes, for a net worldwide decrease of 25 Megatonnes.
…
Figure 1: Global sulfur dioxide emissions by region (North Amer- ica = USA,Canada; East Asia, Japan, China, and South Korea). J.Smith et al., Fig 6.
…
It also proves that the IPCC “Graph of Radiative Forcings” is completely incorrect, since it does not include any warming due to the removal of dimming-aerosols from the atmosphere. To be correct, this forcing needs to be included (which will have the effect of completely eliminating any forcing due to CO2). As noted above, all of the warming can be accounted for by the reduction in SO2 emissions.
New York (CNN Business)Move over, Saudi Arabia. America is about to steal the kingdom’s energy exporting crown.
The United States will surpass Saudi Arabia later this year in exports of oil, natural gas liquids and petroleum products, like gasoline, according to energy research firm Rystad Energy.
That milestone, driven by the transformative shale boom, would make the United States the world’s leading exporter of oil and liquids. That has never happened since Saudi Arabia began selling oil overseas in the 1950s, Rystad said in a report Thursday.
“It’s nothing short of remarkable,” said Ryan Fitzmaurice, energy strategist at Rabobank. “Ten years ago, no one thought it could happen.”
The expected breakthrough reflects how technology has reshaped the global energy landscape. Drilling innovations have opened up huge swaths of oil and natural gas resources that had been trapped in shale oilfields in Texas, North Dakota and elsewhere.
Led by shale, US oil production has more than doubled over the past decade to all-time highs. The United States now pumps more oil than any other country, including Russia and Saudi Arabia.
“The shale boom has driven incredible increases in production,” said Fitzmaurice. “US production is off the charts.”
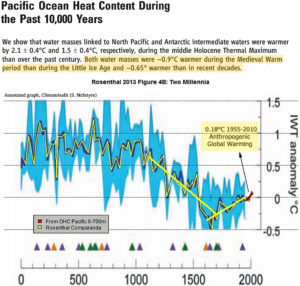
During the Mid-Holocene, when CO2 concentrations were stable and low (270 ppm), Antarctica’s massive Ross Ice Shelf naturally collapsed, adding the meltwater equivalent of 3-4 meters to sea levels.
Because CO2 concentrations changed very modestly during the pre-industrial Holocene (approximately ~25 ppm in 10,000 years), climate models that are predicated on the assumption that CO2 concentration changes drive ocean temperatures, ice sheet melt, and sea level rise necessarily simulate a very stable Holocene climate.
In contrast, changes in ocean temperatures, ice sheet melt, and sea level rise rates were far more abrupt and variable during the Holocene than during the last 100 years.
Modern ocean changes are barely detectable in the context of natural variability
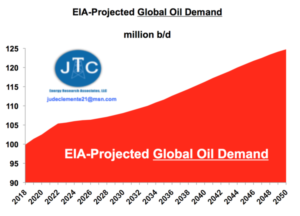
Jude Clemente’s energy articles on Real Clear Energy and Forbes are always worth reading.
Key takeaways:
Major oil company (particularly European majors) predictions of a near-term peak in oil demand are 99.999% driven by politics and the need to appease the investment community.
According to baseball legend, the late, great Yogi Berra, “It’s tough to make predictions, especially about the future.” So, make sure your timeline is long enough to evade having to take responsibility for failed predictions.
Malthuisan predictions have a 100% track record of being wrong.