“Acceleration” in Sea-Level Rise Found to Be False – An artifact of Switching Satellites

by P. Homewood, Feb 27, 2021 in NotaLotofPeopleKnwoThat


One of the most common arguments climate alarmists make is that rate of sea-level rise is “accelerating” or rising faster every year.

Sea-level data reported from satellites indicate seas are rising approximately of 3.3 mm/year (See Figure 1). By contrast, tidal stations have recorded a rise of approximately 1 to 2 mm annually, a rate which is little changed over the century or so for which we have adequate records. Indeed, as reported in Climate at a Glance: Sea Level Rise,  the oldest tide gauge in the USA, in New York City, shows no acceleration at all going back to 1850.

Why the large difference?

The answer it turns out is simple. When NASA and NOAA launched new satellites, the data they produced wasn’t the same as the data recorded by earlier satellites.

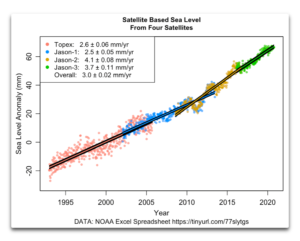
Figure 2. NOAA sea level data, showing the trend of each of the full individual satellite records and the overall trend. SOURCE: NOAA Excel Spreadsheet

Full post here.

The risks of communicating extreme climate forecasts

by COLLEGE OF ENGINEERING, CARNEGIE MELLON UNIVERSITY, Feb 24, 2021 in EurekaAlert!/AAAS


For decades, climate change researchers and activists have used dramatic forecasts to attempt to influence public perception of the problem and as a call to action on climate change. These forecasts have frequently been for events that might be called “apocalyptic,” because they predict cataclysmic events resulting from climate change.

In a new paper published in the International Journal of Global Warming, Carnegie Mellon University’s David Rode and Paul Fischbeck argue that making such forecasts can be counterproductive. “Truly apocalyptic forecasts can only ever be observed in their failure–that is the world did not end as predicted,” says Rode, adjunct research faculty with the Carnegie Mellon Electricity Industry Center, “and observing a string of repeated apocalyptic forecast failures can undermine the public’s trust in the underlying science.”

Rode and Fischbeck, professor of Social & Decision Sciences and Engineering & Public Policy, collected 79 predictions of climate-caused apocalypse going back to the first Earth Day in 1970. With the passage of time, many of these forecasts have since expired; the dates have come and gone uneventfully. In fact, 48 (61%) of the predictions have already expired as of the end of 2020.

Fischbeck noted, “from a forecasting perspective, the ‘problem’ is not only that all of the expired forecasts were wrong, but also that so many of them never admitted to any uncertainty about the date. About 43% of the forecasts in our dataset made no mention of uncertainty.”

Not a myth: State of the Polar Bear Report shows 2020 was another good year for polar bears

by C. Rotter Feb 27, 2021 in WUWT


The ‘State of the Polar Bear Report 2020’ is now available. Forget hand-wringing about what might happen fifty years from now – celebrate the fabulous news that polar bears had yet another good year.

Press release from the Global Warming Policy Forum


Cite as:

Crockford, S.J. 2021. The State of the Polar Bear Report 2020. Global Warming Policy Foundation Report 48, London.

London, 27 February: A prominent Canadian zoologist says that Facebook’s information is gravely out of date and 2020 was another good year for polar bears.

In the State of the Polar Bear Report 2020, published by the Global Warming Policy Foundation (GWPF) on International Polar Bear Day, zoologist Dr. Susan Crockford explains that while the climate change narrative insists that polar bear populations are declining due to reduced sea ice, the scientific literature doesn’t support such a conclusion.

Crockford clarifies that the IUCN’s 2015 Red List assessment for polar bears, which Facebook uses as an authority for ‘fact checking’, is seriously out of date. New and compelling evidence shows bears that in regions with profound summer ice loss are doing well.

Included in that evidence are survey results for 8 of the 19 polar bear subpopulations, only two of which showed insignificant declines after very modest ice loss. The rest were either stable or increasing, and some despite major reductions in sea ice. As a result, the global population size is now almost 30,000 – up from about 26,000 in 2015.

Dr. Crockford points out that in 2020, even though summer sea ice declined to the second lowest levels since 1979, there were no reports of widespread starvation of bears, acts of cannibalism, or drowning deaths that might suggest bears were having trouble surviving the ice-free season.

Yet Another Model-Based Claim Of Anthropogenic Climate Forcing Collapses

by K. Richard, Feb 25 2021 in NoTricksZone


High-resolution climate models have projected a “decline of the Atlantic Meridional Overturning Circulation (AMOC) under the influence of anthropogenic warming” for decades (Lobelle et al., 2020). New research that assesses changes in the deeper layers of the ocean (instead of “ignoring” these layers like past models have) shows instead that the AMOC hasn’t declined for over 30 years.

The North Atlantic has been rapidly cooling in recent decades (Bryden et al., 2020, Fröb et al., 2019). A cooling of “more than 2°C” in just 8 years (2008-2016) and a cooling rate of -0.78°C per decade between 2004 and 2017 has been reported for nearly the entire ocean region just south of Iceland. The cooling persists year-round and extends from the “surface down to 800 m depth”

Mexico was once a climate leader – now it’s betting big on coal

by D. Agren, Feb 15 2021 in TheGuardian


As the climate crisis worsens, Andrés Manuel López Obrador plans to buy nearly 2m tons of thermal coal from small producers

The men on the midnight shift smoked cigarettes and cracked jokes in the glow of their helmet lights as they prepared to go underground. They were loading safety equipment and coils of pipe on to wheelbarrows, in readiness for a second shift due to start working later that week.

“We’re reactivating the industry,” said Arturo Rivera Wong, who had just taken on 40 more workers at the mine he owns in the scrublands of the border state of Coahuila.


“Four furnaces at the big thermoelectric plant are going to be reactivated,” he explained. “This is going to kickstart coal sales.”

As the climate crisis worsens and clean energy prices plunge, governments around the world have been weaning their economies of coal and other fossil fuels.

Mexico is moving in the opposite direction.

President Andrés Manuel López Obrador, popularly known as Amlo, has unveiled plans to buy nearly 2m tons of thermal coal from small producers like Rivera. He also plans to reactivate a pair of coal-fired plants on the Texas border, which were being wound down as natural gas and renewables took a more prominent role in Mexico’s energy mix.

Not only is López Obradorbetting big on fossil fuels, he is also curtailing clean energy.

UN Security Council hears of climate threat, does nothing

by K. Mathiesen, Feb 23 2021 in Politico


When it comes to climate change, bombs don’t work, so the United Nations Security Council prefers words to action.

Tuesday saw the highest profile discussion of climate change in the U.N.’s central body for promoting global peace. But Russia, which holds a veto as a permanent member of the Council, warned against any move to recognize warming as a threat to global security.

Moscow’s stance left the Security Council’s U.K. presidency stabbing at a broken panic button.

Total CEO sees ‘little sense’ in shareholder divestment from oil majors over climate concerns

by A. Fawthrop,  Feb 23, 2021 in NSEnergy


Divesting from major oil and gas producers on grounds of climate change makes “little sense”, says Total chief executive Patrick Pouyanné, because other companies will simply pick up the excess production.

The boss of the French energy firm urged investors and shareholders to support “big players with large balance sheets and financial capacity” because without them the low-carbon energy transition will not “become a reality”.

Stakeholder pressure on the world’s top oil companies is increasing amid heightened concerns over their contribution to climate change and demands for decisive action to reduce emissions across the energy industry.

Many oil and gas firms, including Total, have outlined recent ambitions to gradually pivot away from fossil energy in favour of electrification and alternative fuels.

But public scrutiny remains strong, with warnings of divesting if shareholders do not feel these plans are going far or fast enough, or the business risks associated with climate change are not being adequately addressed.


Oil and gas demand won’t disappear soon, and divesting would leave production for others to take up

Speaking at the IP Week conference today (23 February), Pouyanné called for patience from investors while making a pitch for the role companies like Total have to play in the low-carbon energy transition.


Belgium To Shut All Nuclear Plants

by P. Homewood, Feb 23, 2021 in NotaLotofPeopleKnowThat


BELGIUM’s decision to shut down several of its nuclear power plants has been branded “delusional” and pinned on the EU’s plot to annihilate member states’ independence.

Belgium will shut seven nuclear power plants between 2022 and 2025. The decision was confirmed at the end of 2020 by Alexander De Croo’s coalition government. But the plan would see the country reliant on its neighbours for the supply of electricity – something that was blamed on the increasing integration of the European Union.

http://energodock.com/belgium/electricity-shares

https://www.express.co.uk/news/politics/1401127/Eu-news-Belgium-nuclear-power-plants-closure-France-energy-frexit-florian-Philippot

Wind Power Did Cause The Texas Blackouts!

by P. Homewood, Feb 22, 2021 in NotaLotofPeopleKnowThat


There has been a marked lack of data made public about last week’s blackouts in Texas, which has allowed all sorts of misinformation to fly around. I suspect this is quite deliberate.

I have however found hourly data on the US EIA website. This is what happened on those crucial couple of days:

https://www.eia.gov/beta/electricity/gridmonitor/expanded-view/electric_overview/US48/US48/GenerationByEnergySource-4/edit

Munging The Sea Level Data

by W. Eschenbach, Feb 21, 2021 in WUWT


For more than a decade now, I’ve been wondering about a couple of questions.

First, why does the satellite-based sea-level data show that the sea level is rising so much faster than the rise measured at tidal stations on the coastlines around the world? Records from tidal stations show a rise on the order of a couple of mm per year, a rate which is little changed over the century or so for which we have adequate records. But the satellite record (Figure 1) shows a rise of 3.3 mm/year. Why the large difference?

Second, why does the satellite-based sea-level show such significant acceleration? As mentioned above, the sea-level records from tidal stations, which are much longer, show little or no acceleration. But the satellite record claims that the rate of sea-level rise is increasing by about a tenth of an mm per year. That amount of acceleration would double the rate of sea-level rise in about thirty years. Again, why the large difference?

To start with, here’s what the satellite data says, according to the University of Colorado Sea Level Research Group.

..

NOAA’s Climate Disaster Claims Are A Sham

by C. Rotter, Feb 20, 2021 in WUWT


When a hurricane hits a populated stretch of coast, which is almost invariably, it is inevitable losses will be big. But while last year was a busy year for hurricanes, we do know that the frequency of US hurricanes has not been unusual in the last decade, and if anything the long term trend is down. (Though it is worth noting that the 1980s and 90s were below average, making the choice of 1980 as a start date statistically inappropriate):

Climate Facts or Leaps of Faith? Governments Can’t Tell the Difference

by Donna Laframboise, Feb 17, 2021 in BigPicturesNews


We have no hard evidence of a crisis. Only expert opinion and best estimates.

Governments are currently fighting climate change to the tune of billions. For this to make sense, each idea in the following chain of reasoning needs to be bulletproof:

#1 – scientists know there’s a climate crisis
#2 – scientists know it’s humanity’s fault
#3 – scientists know we can alleviate the crisis by changing our behaviour

But each of these amounts to a leap of faith. Let’s start with the conviction that something unusual is going on. This planet is more than 4 billion years old. The climate was marching to its own drummer long before humans appeared. It has changed numerous times – sometimes gradually, sometimes violently. Twenty thousand years ago, much of North America was covered by ice.

Because humans weren’t recording and analyzing those billions of years of climatic history, today’s scientists have no way of knowing if anything unusual is going on now.

They can surmise. They can speculate. They can extrapolate. But they have no smoking gun. I’ve written two books about the UN’s Intergovernmental Panel on Climate Change (IPCC). That organization says it’s “extremely likely that more than half” of the global warming between 1951 and 2010 was caused by human activity. It talks about its “best estimate.”

Southeast Greenland Sea Surface Temperature 1° – 2°C Warmer In 1940 Than Today, New Study Shows

by P. Gosselin, Feb 14, 2021 in NoTricksZone


A team of Danish scientists led by David Wangner published a paper a year ago about the results of a Greenland sediment core from Skjoldungen Fjord, near the Thrym Glacier, which allowed sea surface temperatures to be reconstructed.

The core covers the past 200 years (1796–2013). The scientists find that the SST record compares well with other alkenone‐based reconstructions from SE‐Greenland and thus features regional shelf water variability.

Today some scientists like claiming the present is warmer than at any time in the past 1000 years and suggest the Greenland ice sheets are rapidly melting. But the results of the core reconstruction show that it was warmer in the past, some 80 years ago

Texas winter storm leaves 2M without power amid frigid temperatures

by E. Fordham, Feb 15, 2021 in FoxNews


HISTORIC WINTER STORM SLAMS TEXAS WITH RECORD COLD, ICY ROADS

Rotating power outages were initiated by the Electric Reliability Council of Texas, or ERCOT, early Monday morning, meaning thousands went without electricity for periods of time as temperatures fell into the teens near Dallas and 20s (about minus 5 degrees Celsius) around Houston.

Austin’s electric utility Austin Energy told residents the outages may be longer than usual, prompting angry social media replies from Texans who said they’d been without power for five or more hours.

“Typical events allow short durations of each outage, but outages are longer if the ERCOT grid requires — which is what we’re seeing in today’s event,” Austin Energy wrote on Twitter.

The utility advised residents to keep their keep their thermostat set to 68 degrees or lower, and to avoid using their oven or washing machine. Businesses were likewise advised to minimize operations to conserve energy.

See also : This Blizzard Exposes The Perils Of Attempting To ‘Electrify Everything’

Biden’s climate ‘fix’ is fantastically expensive and perfectly useless

by B. Lomborg, Feb 9, 2021 in NewYorkPost


Across the world, politicians are going out of their way to promise fantastically expensive climate policies. President Biden has promised to spend $500 billion each year on climate — about 13 percent of the entire federal revenue. The European Union will spend 25 percent of its budget on climate.

Most rich countries now promise to go carbon-neutral by mid-century. Shockingly, only one country has made a serious, independent estimate of the cost: New Zealand found it would optimistically cost 16 percent of its GDP by then, equivalent to the entire current New Zealand budget.

The equivalent cost for the US and the EU would be more than $5 trillion. Each and every year. That is more than the entire US federal budget, or more than the EU governments spend across all budgets for education, recreation, housing, environment, economic affairs, police, courts, defense and health.

Tellingly, the European Commission Vice President Frans Timmermans recently admitted that climate policies would be so costly, it would be a “matter of survival for our industry” without huge, protective border taxes.

Antarctica’s Larsen Ice Shelf Break-Up Driven by Geological Heat Flow Not Climate Change

by J.E. Kamis, Jan 19, 2017 in PlateClimatology


Figure 1  North tip of Antarctic Continent including Larsen Ice Shelf Outline (black line), very active
West Antarctica Rift / Fault System (red lines), and currently erupting or semi-active volcanoes (red dots).

Progressive bottom melting and break-up of West Antarctica’s seafloor hugging Larsen Ice Shelf is fueled by heat and heated fluid flow from numerous very active geological features, and not climate change.

This ice shelf break-up process has been the focus of an absolute worldwide media frenzy contending man-made atmospheric global warming is at work in the northwest peninsula of Antarctica. As evidence, media articles typically include tightly edited close-up photos of cracks forming on the surface of the Larsen Ice Shelf (Figure 2) accompanied by text laced with global warming alarmist catch phrases. This “advertising / marketing” approach does in fact produce beautiful looking and expertly written articles. However, they lack subsidence, specifically a distinct absence of actual scientific data and observations supporting the purported strong connection to manmade atmospheric global warming.

Working level scientists familiar with, or actually performing research on, the Larsen Ice Shelf utilize an entirely different approach when speaking about or writing about what is fueling this glacial ice break-up. They ascribe the break-up to poorly understood undefined natural forces (see quote below). Unfortunately, comments by these scientists are often buried deep in media articles and never seem to match the alarmist tone of the article’s headline.

“Scientists have been monitoring the rift on the ice shelf for decades. Researchers told NBC News that the calving event was “part of the natural evolution of the ice shelf,” but added there could be a link to changing climate, though they had no direct evidence of it.” (see here)

Biden’s climate ‘fix’ is fantastically expensive and perfectly useless-Bjorn Lomborg

by P. Homewood, Feb 214, 2021 in NotaLotofPeopleKnowThat


Across the world, politicians are going out of their way to promise fantastically expensive climate policies. President Biden has promised to spend $500 billion each year on climate — about 13 percent of the entire federal revenue. The European Union will spend 25 percent of its budget on climate.

Most rich countries now promise to go carbon-neutral by mid-century. Shockingly, only one country has made a serious, independent estimate of the cost: New Zealand found it would optimistically cost 16 percent of its GDP by then, equivalent to the entire current New Zealand budget.

The equivalent cost for the US and the EU would be more than $5 trillion. Each and every year. That is more than the entire US federal budget, or more than the EU governments spend across all budgets for education, recreation, housing, environment, economic affairs, police, courts, defense and health.

Tellingly, the European Commission Vice President Frans Timmermans recently admitted that climate policies would be so costly, it would be a “matter of survival for our industry” without huge, protective border taxes.

Climate change is a real, manmade problem. But its impacts are much lower than breathless climate reporting would suggest. The UN Climate Panel finds that if we do nothing, the total impact of climate in the 2070s will be equivalent to reducing incomes by 0.2-2 percent. Given that by then, each person is expected to be 363 percent as rich as today, climate change means we will “only” be 356 percent as rich. Not the end of the world.

Climate policies could end up hurting much more by dramatically cutting growth. For rich countries, lower growth means higher risks of protests and political breakdown. This isn’t surprising. If you live in a burgeoning economy, you know that you and your children will be much better off in the coming years. Hence, you are more forgiving of the present.

….

More trees do not always create a cooler planet, Clark University geographer finds

by Clark University, Feb 14, 203221 in WUWT


WORCESTER, Mass. — New research by Christopher A. Williams, an environmental scientist and professor in Clark University‘s Graduate School of Geography, reveals that deforestation in the U.S. does not always cause planetary warming, as is commonly assumed; instead, in some places, it actually cools the planet. A peer-reviewed study by Williams and his team, “Climate Impacts of U.S. Forest Loss Span Net Warming to Net Cooling,” published today (Feb. 12) in Science Advances. The team’s discovery has important implications for policy and management efforts that are turning to forests to mitigate climate change.

It is well established that forests soak up carbon dioxide from the air and store it in wood and soils, slowing the accumulation of greenhouse gases in the atmosphere; however, that is not their only effect on climate. Forests also tend to be darker than other surfaces, said Professor Williams, causing them to absorb more sunlight and retain heat, a process known as “the albedo effect.”

“We found that in some parts of the country like the Intermountain West, more forest actually leads to a hotter planet when we consider the full climate impacts from both carbon and albedo effects,” said Professor Williams. It is important to consider the albedo effect of forests alongside their well-known carbon storage when aiming to cool the planet, he adds.

Urban Heat Island Effects on U.S. Temperature Trends, 1973-2020: USHCN vs. Hourly Weather Stations

by Roy Spencer, Feb 11, 2021 in GlobalWarming


SUMMARY: The Urban Heat Island (UHI) is shown to have affected U.S. temperature trends in the official NOAA 1,218-station USHCN dataset. I argue that, based upon the importance of quality temperature trend calculations to national energy policy, a new dataset not dependent upon the USHCN Tmax/Tmin observations is required. I find that regression analysis applied to the ISD hourly weather data (mostly from airports)  between many stations’ temperature trends and local population density (as a UHI proxy) can be used to remove the average spurious warming trend component due to UHI. Use of the hourly station data provides a mostly USHCN-independent measure of the U.S. warming trend, without the need for uncertain time-of-observation adjustments. The resulting 311-station average U.S. trend (1973-2020), after removal of the UHI-related spurios trend component, is about +0.13 deg. C/decade, which is only 50%  the USHCN trend of +0.26 C/decade. Regard station data quality, variability among the raw USHCN station trends is 60% greater than among the trends computed from the hourly data, suggesting the USHCN raw data are of a poorer quality. It is recommended that an de-urbanization of trends should be applied to the hourly data (mostly from airports) to achieve a more accurate record of temperature trends in land regions like the U.S. that have a sufficient number of temperature data to make the UHI-vs-trend correction.

The Urban Heat Island: Average vs. Trend Effects

In the last 50 years (1970-2020) the population of the U.S. has increased by a whopping 58%. More people means more infrastructure, more energy consumption (and waste heat production), and even if the population did not increase, our increasing standard of living leads to a variety of increases in manufacturing and consumption, with more businesses, parking lots, air conditioning, etc.

UK National Temperature record at Cambridge Botanic Garden –An examination of the data.

by C. Rotter, Feb 13, 2021 in WUWT


Guest Post by Tony Brown

Section 1 Introduction

A visit to the Botanical gardens in Cambridge was made by the author of this paper on August 7th 2020 between 10.15AM to 12.25pm.  The purpose was to look at the site of the Stevenson screen there,  following the establishment at this location of the highest ever recorded UK instrumental  temperature, confirmed by the Met Office as 38.7 C ( 101.6 Fahrenheit ) taken at the gardens on 25 July 2019, and to determine the possible effects on this record caused by urbanisation.  From the botanic garden web site we note:

 “Analysis of the Garden’s weather records show that over the last 100 years our average temperature has risen by 1.2 Celsius and the hottest day, highest monthly and yearly average have all occurred within the last 20 years. The highest ever temperature recorded at the Garden before this new record was 36.9 C, recorded on 10 August, 2003.”  * See; “Section 5; Temperature trends.”

Cambridge University Botanic Garden records highest ever UK temperature – Cambridge Botanic Garden

Some context is provided by firstly examining the past and present urbanisation of the gardens, the location of the Stevenson screen and there then follows an examination of various temperature recordings locally to determine what affect if any the urbanisation may have had.

The visit  was  made during one of the hottest spells of the 2020 summer and  in similar conditions to the record, in as much it had been hot in the days running up to the record with  prolonged sunshine and light winds and these were mirrored on the day of the visit. The preceding day, August 6th 2020 was partially cloudy and very warm at 27C, close by at Cambridge Airport.

China Facing Winter Blackouts

by P. Homewood, Dec 23, 2020 in NotaLotofPeopleKnowThat


There’s an interesting story emerging from China:

BEIJING: Tens of millions across China are facing power shortages in below-freezing winter temperatures, as three provinces impose curbs on electricity use due to surging demand and a squeezed coal supply.

Residents, factories and businesses in Hunan, Zhejiang and Jiangxi provinces have been ordered to ration electricity with some areas citing a shortfall in coal supplies, according to local media reports and government notices.

China’s rebound from the Covid-19 pandemic has been driven by energy intensive industries such as construction, heaping pressure on the power grid and coal supplies, said Lauri Myllyvirta, lead analyst at the Centre for Research on Energy and Clean Air.

Earlier this month, Hunan authorities ordered all billboards and outdoor lighting on buildings to power off for long periods each day and a temperature cap on indoor heating at entertainment venues.

Hunan faces a shortfall of 3-4 million kilowatts of electricity this winter, local officials admitted last week, as demand soars due to unusually cold weather that will hit as low as -10°C.

Office workers in provincial capital Changsha complained on social media about being forced to climb dozens of flights of stairs and freezing indoor temperatures as a result of frequent power outages.

“My office heating has already been stopped, and there were blackouts on Dec 1, 3 and 5. Temperatures will drop to -8°C around New Year’s Day, will I freeze to death in Hunan?” one Weibo user wrote last week.

Meanwhile in Zhejiang province, factories in the manufacturing hub of Yiwu have been told to stop operations and streetlights have been turned off at night as part of an emissions-saving drive by the local government, according to media reports and photos circulated on Weibo.

Polar bear sea ice habitat highs and lows in early February

by Polar Bear Science, Feb 10, 2021


Sea ice across the Arctic in the first week of February is a mix of highs and lows. Bering Sea is back up to almost normal coverage, as is the Barents Sea. However, ice coverage on the East Coast of Canada is the lowest its been in four decades. This is not yet a worry for polar bears because harp seals don’t pup until mid-March in this region so there is at least four weeks of potential ice growth that can happen before the seals are forced to pup on much reduced ice – where polar bears are sure to find them.

CMIP6 and AR6, a preview

by Andy May, Feb 11, 2021 in WUWT


The new IPCC report, abbreviated “AR6,” is due to come out between April 2021 (the Physical Science Basis) and June of 2022 (the Synthesis Report). I’ve purchased some very strong hip waders to prepare for the events. For those who don’t already know, sturdy hip waders are required when wading into sewage. I’ve also taken a quick look at the CMIP6 model output that has been posted to the KNMI Climate Explorer to date. I thought I’d share some of what I found.

India to overtake EU as world’s third largest energy consumer by 2030: IEA

by P. Homewood, Feb 20, 2021 in NotaLofPeopleKnowThat


India will overtake the European Union as the world’s third-largest energy consumer by 2030, the International Energy Agency (IEA) said on Tuesday as it forecast India accounting for the biggest share of energy demand growth over the next two decades.

In its India Energy Outlook 2021, IEA saw primary energy consumption almost doubling to 1,123 million tonnes of oil equivalent as the Gross Domestic Product (GDP) expands to USD 8.6 trillion by 2040.

India at present is the fourth-largest global energy consumer behind China, the United States and the European Union.

Underpinned by “a rate of GDP growth that adds the equivalent of another Japan to the world economy by 2040”, India will overtake the European Union by 2030 to move up to the third position, it said in the report.

India accounts for nearly one-quarter of global energy demand growth from 2019-40 — the largest for any country. Its share in the growth in renewable energy is the second-largest in the world, after China, IEA said.

“By 2040, India’s power system is bigger than that of the European Union, and is the world’s third-largest in terms of electricity generation; it also has 30 per cent more installed renewables capacity than the United States,” it said.

A five-fold increase in per capita car ownership will result in India leading the oil demand growth in the world. Also, it will become the fastest-growing market for natural gas, with demand more than tripling by 2040.

Hematite reconstruction of Late Triassic hydroclimate over the Colorado Plateau

by Lepre, J & Olsen P.E., Feb 21, 2021 PNAS


Significance

Hematite provides much of the color for the classic Triassic–Jurassic “red beds” of North America and elsewhere. Measuring the spectrum of visible light reflected and absorbed by the red beds, we demonstrate that the hematite concentrations faithfully track 14.5 million years of Late Triassic monsoonal rainfall over the Colorado Plateau of Arizona and use this information to assess interrelationships between environmental perturbations, climate, and the evolution of terrestrial vertebrates. The research challenges conventional ideas that the hematite has limited use for interpreting the ancient past because it is a product of natural chemical alterations that occurred long after the beds were initially deposited.

Abstract

Hematite is the most abundant surficial iron oxide on Earth resulting from near-surface processes that make it important for addressing numerous geologic problems. While red beds have proved to be excellent paleomagnetic recorders, the early diagenetic origin of hematite in these units is often questioned. Here, we validate pigmentary hematite (“pigmentite”) as a proxy indicator for the Late Triassic environment and its penecontemporaneous origin by analyzing spectrophotometric measurements of a 14.5-My–long red bed sequence in scientific drill core CPCP-PFNP13-1A of the Chinle Formation, Arizona. Pigmentite concentrations in the red beds track the evolving pattern of the Late Triassic monsoon and indicate a long-term rise in aridity beginning at ∼215 Ma followed by increased oscillatory climate change at ∼213 Ma. These monsoonal changes are attributed to the northward drift of the Colorado Plateau as part of Laurentia into the arid subtropics during a time of fluctuating CO2. Our results refine the record of the Late Triassic monsoon and indicate significant changes in rainfall proximal to the Adamanian–Revueltian biotic transition that thus may have contributed to apparent faunal and floral events at 216 to 213 Ma.