Archives par mot-clé : Urban Heat

Classifying Land Temperature Stations as Either “Urban” or “Rural” in UHI Studies Proves Nothing about Spurious Temperature Trends

by Dr. Roy Spencer, Apr 5, 2023 in WUWT


From Dr. Roy Spencer’s Global Warming Blog

by Roy W. Spencer, Ph. D.

As I spend more time working on a research project, the more time I have to reflect on things that others have simply assumed to be true. And in the process I sometimes have an epiphany than clarifies my thinking on a subject.

As I continue to investigate how to quantify urban heat island (UHI) effects for the purpose of determining the extent to which land surface temperature trends have been spuriously inflated by urbanization effects, there is one recurring theme I find has not been handled well in previously published papers on the subject. I’ve mentioned it before, but it’s so important, it deserves its own (brief) blog post.

It has to do with the common assumption that “urban” thermometer sites experience spurious warming over time, while “rural” sites do not.

Obviously, at any given point in time urban environments are warmer than rural environments, especially at night. And urbanization has increased around temperature monitoring sites over the last 50 to 100 years (and longer). Yet, a number of studies over the years have curiously found that urban and rural sites have very similar temperature trends. This has led investigators to conclude that temperature datasets such as the Global Historical Climate Network (GHCN), especially after “homogenization”, is largely free of spurious warming effects from urbanization.

But the conclusion is wrong…all it shows is that temperature trends between rural and urban sites are similar… not that those trends are unaffected by urbanization effects.

Instead, studies have demonstrated that the greatest rate of warming as population increases is for nearly-rural sites, not urban. The one-fourth power relationship found by Oke (1973) and others (and which I am also finding in GHCN data in the summer) means that a population density increase from 1 to 10 persons per sq. km (both “rural”) produces more warming than an urban site going from 1,000 to 1,700 persons per sq. km.

Thus, “rural” sites cannot be assumed to be immune to spurious warming from urbanization. This means that studies that have compared “rural” to “urban” temperature trends haven’t really proved anything.

The mistake people have made is to assume that just because urban locations are warmer than rural locations at any given time that they then have a much larger spurious warming impact on trends over timeThat is simply not true.

Re-evaluating the role of solar variability on Northern Hemisphere temperature trends since the 19th century

by W. Soon et al., 2015 in EarthScienceReviews


Abstract

Debate over what influence (if any) solar variability has had on surface air temperature trends since the 19th century has been controversial. In this paper, we consider two factors which may have contributed to this controversy:

1.

Several different solar variability datasets exist. While each of these datasets is constructed on plausible grounds, they often imply contradictory estimates for the trends in solar activity since the 19th century.

2.

Although attempts have been made to account for non-climatic biases in previous estimates of surface air temperature trends, recent research by two of the authors has shown that current estimates are likely still affected by non-climatic biases, particularly urbanization bias.

With these points in mind, we first review the debate over solar variability. We summarise the points of general agreement between most groups and the aspects which still remain controversial. We discuss possible future research which may help resolve the controversy of these aspects. Then, in order to account for the problem of urbanization bias, we compile a new estimate of Northern Hemisphere surface air temperature trends since 1881, using records from predominantly rural stations in the monthly Global Historical Climatology Network dataset. Like previous weather station-based estimates, our new estimate suggests that surface air temperatures warmed during the 1880s–1940s and 1980s–2000s. However, this new estimate suggests these two warming periods were separated by a pronounced cooling period during the 1950s–1970s and that the relative warmth of the mid-20th century warm period was comparable to the recent warm period.

We then compare our weather station-based temperature trend estimate to several other independent estimates. This new record is found to be consistent with estimates of Northern Hemisphere Sea Surface Temperature (SST) trends, as well as temperature proxy-based estimates derived from glacier length records and from tree ring widths. However, the multi-model means of the recent Coupled Model Intercomparison Project Phase 5 (CMIP5) climate model hindcasts were unable to adequately reproduce the new estimate — although the modelling of certain volcanic eruptions did seem to be reasonably well reproduced.

Finally, we compare our new composite to one of the solar variability datasets not considered by the CMIP5 climate models, i.e., Scafetta and Willson, 2014’s update to the Hoyt and Schatten, 1993 dataset. A strong correlation is found between these two datasets, implying that solar variability has been the dominant influence on Northern Hemisphere temperature trends since at least 1881. We discuss the significance of this apparent correlation, and its implications for previous studies which have instead suggested that increasing atmospheric carbon dioxide has been the dominant influence.

…Temperature Records…

by Donn Dears, March 2, 2021


There has been an unending stream of media reports about how the last few years have been the warmest on record.

They gloss over that they are only referring to the last 150 years, because temperatures have been higher than today on several occasions over the past 10,000 years, a period between glaciations know as the Holocene.

Recently, a presentation by Tony Heller caught my attention, in which he had facts, coupled with evidence, that shed light on the media’s hypocrisy. 

What follows uses some of the materials from Mr. Heller’s presentation, coupled with additional information. (Relevant links are itemized below.)

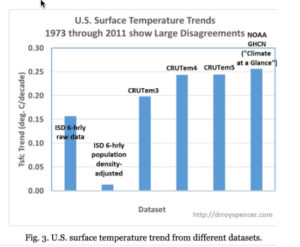
The first chart is Figure 3, from Dr. Roy Spencer’s evaluation of the heat island effect.

It shows that the urban heat island effect has skewed reported temperatures higher than where population density is low. Areas with low population density are representative of the vast majority of land surface areas.


Today’s temperatures are not the highest, or second highest, on record: Not for the past one-hundred-fifty years, or for the past 10,0000 years.

Links

Heller: https://bit.ly/2LrkLXf

Spencer:http://bit.ly/2N4fmpf

Real Climate Science:https://bit.ly/3cVlDhU

Urban Heat Island Effects on U.S. Temperature Trends, 1973-2020: USHCN vs. Hourly Weather Stations

by Roy Spencer, Feb 11, 2021 in GlobalWarming


SUMMARY: The Urban Heat Island (UHI) is shown to have affected U.S. temperature trends in the official NOAA 1,218-station USHCN dataset. I argue that, based upon the importance of quality temperature trend calculations to national energy policy, a new dataset not dependent upon the USHCN Tmax/Tmin observations is required. I find that regression analysis applied to the ISD hourly weather data (mostly from airports)  between many stations’ temperature trends and local population density (as a UHI proxy) can be used to remove the average spurious warming trend component due to UHI. Use of the hourly station data provides a mostly USHCN-independent measure of the U.S. warming trend, without the need for uncertain time-of-observation adjustments. The resulting 311-station average U.S. trend (1973-2020), after removal of the UHI-related spurios trend component, is about +0.13 deg. C/decade, which is only 50%  the USHCN trend of +0.26 C/decade. Regard station data quality, variability among the raw USHCN station trends is 60% greater than among the trends computed from the hourly data, suggesting the USHCN raw data are of a poorer quality. It is recommended that an de-urbanization of trends should be applied to the hourly data (mostly from airports) to achieve a more accurate record of temperature trends in land regions like the U.S. that have a sufficient number of temperature data to make the UHI-vs-trend correction.

The Urban Heat Island: Average vs. Trend Effects

In the last 50 years (1970-2020) the population of the U.S. has increased by a whopping 58%. More people means more infrastructure, more energy consumption (and waste heat production), and even if the population did not increase, our increasing standard of living leads to a variety of increases in manufacturing and consumption, with more businesses, parking lots, air conditioning, etc.

UK National Temperature record at Cambridge Botanic Garden –An examination of the data.

by C. Rotter, Feb 13, 2021 in WUWT


Guest Post by Tony Brown

Section 1 Introduction

A visit to the Botanical gardens in Cambridge was made by the author of this paper on August 7th 2020 between 10.15AM to 12.25pm.  The purpose was to look at the site of the Stevenson screen there,  following the establishment at this location of the highest ever recorded UK instrumental  temperature, confirmed by the Met Office as 38.7 C ( 101.6 Fahrenheit ) taken at the gardens on 25 July 2019, and to determine the possible effects on this record caused by urbanisation.  From the botanic garden web site we note:

 “Analysis of the Garden’s weather records show that over the last 100 years our average temperature has risen by 1.2 Celsius and the hottest day, highest monthly and yearly average have all occurred within the last 20 years. The highest ever temperature recorded at the Garden before this new record was 36.9 C, recorded on 10 August, 2003.”  * See; “Section 5; Temperature trends.”

Cambridge University Botanic Garden records highest ever UK temperature – Cambridge Botanic Garden

Some context is provided by firstly examining the past and present urbanisation of the gardens, the location of the Stevenson screen and there then follows an examination of various temperature recordings locally to determine what affect if any the urbanisation may have had.

The visit  was  made during one of the hottest spells of the 2020 summer and  in similar conditions to the record, in as much it had been hot in the days running up to the record with  prolonged sunshine and light winds and these were mirrored on the day of the visit. The preceding day, August 6th 2020 was partially cloudy and very warm at 27C, close by at Cambridge Airport.

Germany’s DWD National Weather Service Denies Station Siting Problem: “Dubious” All-Time Record Temperature Allowed To Stand

by P. Gosselin, May 26, 2020 in NoTricksZone


Leading German daily Bild here reports on the controversy, which still continues to swirl, over Germany’s all-time record high temperature recorded last year in North Germany near the Dutch border.

Independent meteorologists say the readings needs to be thrown out

Last year on July 25th, the Lingen thermometer reached a whopping 42.6°C, far eclipsing the old German all-time record of 40.3°C. But that recording quickly came under fire by independent weather experts who say the station data were  corrupted by siting issues. The Lingen station is located in a depression in the earth, near a parking lot, and shielded by trees from the wind, thus creating the ideal conditions for trapping heat.

Comparison to nearby stations shows huge anomaly

Last year NTZ reported on the controversial record here noting that surrounding stations did not even come close to record reading in Lingen. What follows is a comparison of the Lingen’s readings to those of 6 nearby stations over the five day period, July 23 – July 27:

La localisation temporelle et géographique des stations de mesure de la température pose des problèmes

by Carl-Stéphane Huot, 30 juillet 2019 in ScienceClimatEnergie


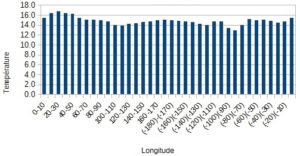
La notion de réchauffement climatique préoccupe bon nombre de gens depuis des années. Cependant, ce réchauffement apparent pourrait être influencé par le déplacement de stations météorologiques vers les zones plus chaudes de la planète, soit plus  près de l’équateur, soit à des altitudes plus basses.  La modélisation du climat est aussi influencée par l’existence de régions sans, ou avec très peu, de stations météorologiques.

Graphique 1 : Température moyenne selon la classe de longitude.

Conclusion

La variation extrêmement élevée du nombre de stations météorologiques servant au calcul de la température mondiale a contribué depuis le début des années 1950 à une partie au moins de l’élévation de  température. La dérive de celles-ci d’une place à l’autre fausse la précision des données que l’on peut en tirer, et contribue à augmenter l’inquiétude de la population. L’emplacement et le nombre de stations à installer posent un certain nombre de problèmes autant scientifiques que techniques et  politiques, et rend, avec d’autres éléments, (par exemple l’effet d’urbanisation, non abordé ici) extrêmement difficile de parler de réchauffement climatique.

New Record Temperature–But How Much Of It Is Due To UHI?

by P. Homewood, July 30, 2019 in NotaLotofPeopleKnowThat


Cambridge University Botanic Garden measured 38.7C (101.7F) on Thursday beating the previous UK record of 38.5C (101.3F), set in Kent in 2003.

A Met Office official was sent to check the equipment before verifying the new record on Monday.

Staff working at the garden on Thursday tweeted: “No wonder we all felt as if we’d melted.”

Daily temperatures have been measured by the weather station at the site in the south of the city since 1904.

Cambridge University Botanic Garden director, Beverley Glover, said: “We are really pleased that our careful recording of the weather, something that we’ve been doing every day for over 100 years at the Botanic Garden, has been useful to the Met Office in defining the scale of this latest heatwave.

“Our long history of weather recording is very important to researchers analysing climate change.

“However, we can’t help but feel dismay at the high temperature recorded and the implication that our local climate is getting hotter, with inevitable consequences for the plants and animals around us.”

https://www.bbc.co.uk/news/uk-49157898


In fact, Cambridge’s new record tells us very little about “climate change”, but an awful lot about the Urban Heat Island Effect, or UHI.

China is warming fastest where the cities are, not where the models predicted – classic UHI

by JoNova, July 24, 2019


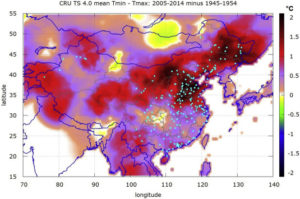
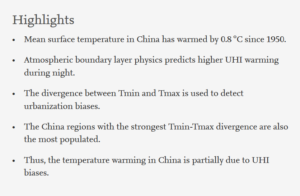
The biggest changes in temperature (“divergence” in dark red brown Fig 6) occurred where the most people lived (blue dots). In the 60 years to 2010 China was reported to have warmed by 0.79 ± 0.10 °C. However Scafetta et al calculate at most, China could have experienced a real warming of only 0.46 ± 0.13 °C.

Somehow the combined might and supercomputers at NOAA, NASA, Hadley and the Bureau of Met experts all missed this.

It’s another third of a degree gone from the Glorious CO2 Narrative. Just like that.


Is there a  more perfect nation to study the Urban Heat Island effect than China?

The worlds most populous nation has made a blistering transformation in two decades. As recently as 1995 the population was 75% rural. Now it’s approaching 60% urban. Shenzhen, which is near Hong Kong, grew from 3000 people in 1950 to more than 10 million in 2010. Around Beijing, thousands of towns have been built in a networked carpet, each a mere 2km apart (zoom in on Google satellite view). The stations in these areas are effectively not rural anymore.

See also here

Lingen Cheated: Germany’s New All-Time Record High Resulted From DWD Weather Service Lousy Station Siting

by P. Gosselin, July 28, 2019 in NoTricksZone


During last week’s record-setting European heat wave, Germany’s previous record of 40.3C was impressively shattered by the measurement station located at the northwest city of Lingen, near the Dutch border, some 50 kilometers from where I live. The German DWD weather service and media loved it!

Controversial siting

Yet, controversy now swirls about the new record setting measurement since it has come to light that the measurement is fraught with some considerable siting issues.

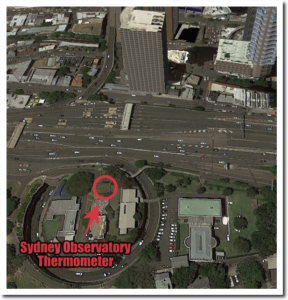
As the photo published by T-online here shows, the station is located right near a DWD office building, is shielded from the wind by grown trees and is located not far from a public swimming pool.

Meteorologist Michael Theusner told t-online.de: “The monthly average of the daily highs in Lingen has been deviating more and more upwards from the average of the highs in Lower Saxony since 2010.” The station has become increasingly shielded and thus tends to heat up more.

Swiss veteran meteorologist Jörg Kachelmann wrote the extra heat possibly could be heating the station by up to another 3 degrees!

DWD accepts overheated reading

Urban Heat Island (or UHI)

by Roger A. Pielke Sr,  July 25, 2019


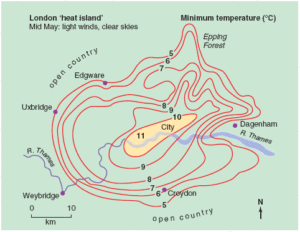
The urban heat island effect is a well-documented example of inadvertent modification of climate by human activities in the form of increased temperatures of urban areas compared to a city’s rural surroundings. It is a fine example of how changing the energy balance of a region can affect the regional climate.

On average, the city is warmer than the countryside because of differences between the energy gains and losses of each region. There are a number of factors that contribute to the relative warmth of cities, such as heat from industrial activity, the thermal properties of buildings, and the evaporation of water. For example, the heat produced by heating and cooling city buildings and running planes, trains, buses, and automobiles contributes to the warmer city temperatures. Heat generated by these objects eventually makes its way into the atmosphere, adding as much as one third of the heat received from solar energy. The architecture of cities intensifies UHI effect. The canyon shape of the tall buildings and the narrow space between them magnifies the longwave energy gains. During the day, solar energy is trapped by multiple reflections off the many closely spaced, tall buildings, reducing heat losses by longwave radiation (See schematic below). Pollution in the city’s air also modifies the absorption of longwave and shortwave radiation of the atmosphere.

Land’s complex role in climate change

by  Pielke et al., 2016 in PhysicsToday


To date, most reporting on climate has focused on the possibility of catastrophic warming due to carbon dioxide and other greenhouse gases released into the atmosphere. The assessment of climate change risk has essentially been distilled to a single metric: the global average surface temperature. That reality was evident at the 2015 United Nations Climate Change Conference in Paris, where the central negotiating point was whether the global temperature rise should be limited to 1.5 °C or 2 °C. Indeed, a 2016 opinion piece by Simon Lewis (University College London and the University of Leeds, UK) states that, “by endorsing a limit of 1.5 °C, the [Paris] climate negotiations have effectively defined what society considers dangerous.”

But the reality of humans’ impact on climate is exceedingly complex.2 Even if greenhouse gas emissions could be elimi- nated completely, other harmful anthropogenic sources of cli- mate change would remain. And even if global average tem- peratures were contained, human impacts on climate would manifest in other potentially dangerous ways.

One often overlooked human factor is land use. Deforestation, dry land farming, irrigated agriculture, overgrazing, and other alterations to the natural landscape can disrupt Earth’s natural balances and change weather patterns. As with the addition of CO2into the atmosphere, the effects can last for decades or longer and affect regions distant from the original offense. Given continued rapid population growth, they threaten to be irreversible.

SCE INFO : 45,9°C un record en France ?

by SCE-INFO, 3 juillet 2019 in ScienceClimatEnergie


De nombreux médias l’ont annoncé, tout comme le site MétéoFrance : la barre des 45 °C aurait été franchie pour la première fois en France vendredi 28 juin 2019. On a atteint 45,9 °C à Gallargues-le-Montueux, à l’ouest du Gard, à 16 h 20. Ce serait une première en France depuis que l’on fait des mesures de températures. Température exceptionnelle? Sans remettre en cause le réchauffement global de la basse troposphère, ni l’augmentation de la fréquence des vagues de chaleur constatée par le GIEC, certaines remarques doivent être faites concernant ce record de température.

Avant de sombrer dans le catastrophisme, il est important de “garder la tête froide” et de considérer les quelques points suivants :

1. Une telle température a peut-être déjà été atteinte dans le passé proche, mais n’a tout simplement pas été mesurée. N’oubliez pas qu’il n’y avait pas autant de thermomètres il y a cent ans. Par exemple, en 1865, il n’y avait en France que deux observatoires astronomiques effectuant des observations météorologiques quotidiennes (voir ici). Aujourd’hui, les stations météorologiques professionnelles du réseau de Météo-France, appelé réseau Radome, ne sont que de 554 pour le France métropolitaine. Il faudrait évidemment plus de stations pour monitorer les 643 801 km² de territoire. Aujourd’hui, cela fait une station pour 1162 km2.

2. Pendant l’été 1930, une vague de chaleur a traversé la France, comme l’atteste le petit article de journal ci-dessous (Figure 1) retrouvé dans “The Telegraph” (Brisbane). Les températures sont données en Fahrenheit et 122 Fahrenheit correspondent à 50°C. Bien que l’article ne donne pas les détails de la mesure (il faut donc rester prudent) nous voyons que de telles vagues de chaleurs se sont déjà produites dans le passé. Voyez également ce qui s’est passé en 1900, 1911, 1921 et 1934  ici.

Our Urban “Climate Crisis”

by Jim Steele, May 17, 2019 in WUWT


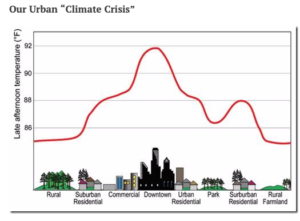
Based on a globally averaged statistic, some scientists and several politicians claim we are facing a climate crisis. Although it’s wise to think globally, organisms are never affected by global averages. Never! Organisms only respond to local conditions. Always! Given that weather stations around the globe only record local conditions, it is important to understand over one third of the earth’s weather stations report a cooling trend (i.e. Fig 4 below ) Cooling trends have various local and regional causes, but clearly, areas with cooling trends are not facing a “warming climate crisis”. Unfortunately, by averaging cooling and warming trends, the local factors affecting varied trends have been obscured.

It is well known as human populations grow, landscapes lose increasing amounts of natural vegetation, experience a loss of soil moisture and are increasingly covered by heat absorbing pavement and structures. All those factors raise temperatures so that a city’s downtown area can be 10°F higher than nearby rural areas. Despite urban areas representing less than 3% of the USA’s land surface, 82% of our weather stations are located in urbanized areas. This prompts critical thinkers to ask, “have warmer urbanized landscapes biased the globally averaged temperature?” (Arctic warming also biases the global average, but that dynamic must await a future article.)

How much has urbanisation affected United Kingdom temperatures?

by P. Homewood, May 6, 2019 in NotaLotofPeopleKnowThat


This study aims to estimate the affect of urbanisation on daily maximum and minimum temperatures in the United Kingdom. Urban fractions were calculated for 10 km × 10 km areas surrounding meteorological weather stations. Using robust regression a linear relationship between urban fraction and temperature difference between station measurements and ERA‐Interim reanalysis temperatures was estimated. For an urban fraction of 1.0, the daily minimum 2‐m temperature was estimated to increase by 1.90 ± 0.88 K while the daily maximum temperature was not significantly affected by urbanisation. This result was then applied to the whole United Kingdom with a maximum T min urban heat island intensity (UHII) of about 1.7K in London and with many UK cities having T min UHIIs above one degree.

This paper finds through the method of observation minus reanalysis that urbanisation has significantly increased the daily minimum 2‐m temperature in the United Kingdom by up to 1.70 K.

https://rmets.onlinelibrary.wiley.com/doi/full/10.1002/asl.896

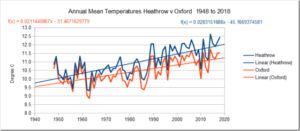
As ever, the real issue with UHI is the change in the effect over time. Has, for instance, the effect of UHI increased in London and other cities increased over the last century, or was it just as great in 1919?

What we do know is that, generally speaking, towns and cities have both expanded over time, and seen increasing development in terms of roads, buildings, traffic and economic activity.

Indeed, these same tendencies also apply in small towns and what may appear to be relatively rural sites.

We also know that many of the sites used by the Met Office in their UK temperature series are urban and airport locations.

https://www.metoffice.gov.uk/public/weather/climate-historic/#?tab=climateHistoric

BIG NEWS – Verified by NOAA – poor weather station siting leads to artificial long term warming

by Anthony Watts, May 3, 2019 in WUWT


I’ve been saying for years that surface temperature measurements (and long term trends) have been affected by encroachment of urbanization on the placement of weather stations used to measure surface air temperature, and track long term climate. In doing so we found some hilariously bad examples of climate science in action, such as the official USHCN climate monitoring station at the University of Arizona, Tucson:


USHCN weather station in a parking lot. University of Arizona, Tucson

I have published on the topic in the scientific literature, and found this to be true based on the science we’ve done of examining the USHCN and applying the siting methodology of Leroy 2010.

In Fall et al, 2011 we discovered that there was a change to the diurnal temperature range (DTR). It decreased where stations had been encroached upon, because of the heat sink effect of man-made materials (asphalt, concrete, bricks, etc.) that were near stations.

Impacts of Small-Scale Urban Encroachment on Air Temperature Observations

by R.D. Leeper et al., 2019 in J.Appl.Met.Climatology


A field experiment was performed in Oak Ridge, TN, with four instrumented towers placed over grass at increasing distances (4, 30, 50, 124, and 300 m) from a built-up area. Stations were aligned in such a way to simulate the impact of small-scale encroachment on temperature observations. As expected, temperature observations were warmest for the site closest to the built environment with an average temperature difference of 0.31 and 0.24 °C for aspirated and unaspirated sensors respectively. Mean aspirated temperature differences were greater during the evening (0.47 °C) than day (0.16 °C). This was particularly true for evenings following greater daytime solar insolation (20+ MJDay−1) with surface winds from the direction of the built environment where mean differences exceeded 0.80 °C. The impact of the built environment on air temperature diminished with distance with a warm bias only detectable out to tower-B’ located 50 meters away.

The experimental findings were comparable to a known case of urban encroachment at a U. S. Climate Reference Network station in Kingston, RI. The experimental and operational results both lead to reductions in the diurnal temperature range of ~0.39 °C for fan aspirated sensors. Interestingly, the unaspirated sensor had a larger reduction in DTR of 0.48 °C. These results suggest that small-scale urban encroachment within 50 meters of a station can have important impacts on daily temperature extrema (maximum and minimum) with the magnitude of these differences dependent upon prevailing environmental conditions and sensing technology.

The Climate Sciences Use Of The Urban Heat Island Effect Is Pathetic And Misleading

by Geoffrey Sherrington, December 20, 2018 in WUWT


ABSTRACT.

The ‘urban heat island’ arises because air temperatures measured in urban cities can be different to those of the rural city surroundings. Thermometers were and still are more often found in cities than surroundings. City temperatures have a synthetic, man-made component that needs to be subtracted to match the surrounding rural temperatures, which are the items of interest for climate studies.

Failure to subtract the UHI effect will lead to false results for temperature trends such as those used to claim global warming. The question arises whether rural and urban temperatures have adequate accuracy to provide reasonable results after the subtraction. This essay argues that historic Australian rural temperature records are unfit for this purpose; that global temperature records are likely to be similarly inadequate; and that as a consequence, all past estimates of UHI derived from land surface temperatures by thermometry are invalid or questionable.

In short, all past estimates of UHI magnitude before the satellite era are incorrect for reasons given. The actual rates of global temperature changes over the past century are likely to be wrong by a significant amount, of similar magnitude to the global warming claimed at about 1°C per century.

More recent estimates are being made with temperatures from instruments on satellites, which help the future path to better understanding.

Laughable weather station maintenance causes highest ever temperature record in Spain

by Anthony Watts, August 6, 2018 in WUWT


h/t to Dr. Ryan Maue

In Spain, Paco Eslava García has been following my lead on the poor quality of weather stations that produce record-high temperatures. I recently pointed out how the tentative all time high temperature in Africa could very well be due to being at an airport. I also pointed out that high temperature records in the Los Angeles area could be a product of poor siting. Such as this station on the roof of the Santa Ana fire station:

Using reflective pavements to mitigate urban heat island in warm climates – Results from a large scale urban mitigation project

by G.E. Kyriakodis and M. Santamouris, June 2018, in UrbanClimate


Highlights

Large scale implementation of cool asphaltic and concrete photocatalytic pavements

Extensive monitoring strategy of in situ measurements in the area

Surface temperatures reduction up to 7.5 °C and 6.1 °C respectively in the summer period, while the peak drop was up to 11.5 °C

The maximum air temperature reduction could reach 1.5 °C.

Ageing phenomena may reduce substantially and up to 50% the mitigation potential of cool asphaltic materials.

Comparing the current and early 20th century warm periods in China

by Willie W.H. Soon et al., May 22, 2018 in EarthScienceReviews


Most estimates of Chinese regional Surface Air Temperatures since the late-19th century have identified two relatively warm periods – 1920s–40s and 1990s–present. However, there is considerable debate over how the two periods compare to each other. Some argue the current warm period is much warmer than the earlier warm period. Others argue the earlier warm period was comparable to the present. In this collaborative paper, including authors from both camps, the reasons for this ongoing debate are discussed. Several different estimates of Chinese temperature trends, both new and previously published, are considered. A study of the effects of urbanization bias on Chinese temperature trends was carried out using the new updated version of the Global Historical Climatology Network (GHCN) – version 4 (currently in beta production)

(…)

China’s Urban Heat Island Problem

by Anthony Watts, April 25, 2018 in WUWT


Beijing has undergone several important urbanization development stages since late 1978. Linked with urbanization, the so-called “urban heat island effect” is a key problem caused by urban land expansion. Such changes in air temperature in Beijing inevitably have an impact on the daily lives of its inhabitants, and is therefore of considerable interest to scientists and the wider public alike.

Dr. Xiaojuan LIU and Associate Professor Guangjin TIAN from the School of Environment, Beijing Normal University, used the mesoscale Weather Research and Forecasting model coupled with a single urban canopy model and high-resolution land cover data to analyze the spatial and temporal patterns of summertime urban warming influenced by three stages of urban land expansion during 1990-2010 across Beijing. They found that urban-induced warming increased with urban land expansion, but the speed of warming declined slightly during 2000-10.

Study: city street & building layout determine intensity of the Urban Heat Island effect

by A. Watts, February 23, 2018 in WUWT


How cities heat up
The way streets and buildings are arranged makes a big difference in how heat builds up, study shows

CAMBRIDGE, Mass. – The arrangement of a city’s streets and buildings plays a crucial role in the local urban heat island effect, which causes cities to be hotter than their surroundings, researchers have found. The new finding could provide city planners and officials with new ways to influence those effects.

Some cities, such as New York and Chicago, are laid out on a precise grid, like the atoms in a crystal, while others such as Boston or London are arranged more chaotically, like the disordered atoms in a liquid or glass. The researchers found that the “crystalline” cities had a far greater buildup of heat compared to their surroundings than did the “glass-like” ones.