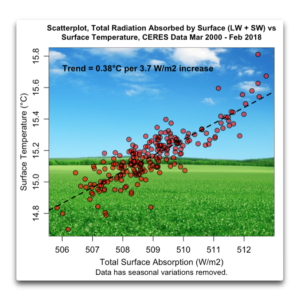
I kept going back and looking at the graphic from my previous post on radiation and temperature. It kept niggling at me. It shows the change in surface temperature compared to the contemporaneous change in how much energy the surface is absorbing. Here’s that graphic again:
Figure 1. From my previous post. It is a scatterplot showing the dependence of temperature on the total downwelling radiation (longwave plus shortwave) absorbed by the surface.
What I found botheracious were the outliers at the top of the diagram. I knew what they were from, which was the El Nino/La Nina of 2015-2016.
After thinking about that, I realized I’d left one factor out of the calculations above. What the El Nino phenomenon does is to periodically pump billions of cubic meters of the warmest Pacific equatorial water towards the poles. And I’d left that advected energy transfer out of the equation in Figure 1. (Horizontal transfer of energy from one place on earth to another is called “advection”).
And it’s not just advection of energy caused by El Nino. In general, heat is advected from the tropics towards the poles by the action of the ocean and the atmosphere. Figure 2 shows the average amount of energy exported (plus) or imported (minus) around the globe.
…
La géologie, une science plus que passionnante … et diverse