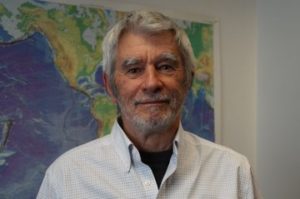
Full-time professor at the Free University of Brussels, Belgium
apreat@gmail.com
apreat@ulb.ac.be
• Department of Earth Sciences and Environment
Res. Grp. - Biogeochemistry & Modeling of the Earth System
Sedimentology & Basin Analysis
• Alumnus, Collège des Alumni, Académie Royale de Sciences, des Lettres et des Beaux Arts de Belgique (mars 2013). http://www.academieroyale.be/cgi?usr=2a8crwkksq&lg=fr&pag=858&rec=0&frm=0&par=aybabtu&id=4471&flux=8365323
• Prof. Invited, Université de Mons-Hainaut (2010-present-day)
• Prof. Coordinator and invited to the Royal Academy of Sciences of Belgium (Belgian College) (2009-
present day)
• Prof. partim to the DEA (third cycle) led by the University of Lille (9 universities from 1999 to 2004) - Prof. partim at the University of Paris-Sud/Orsay, European-Socrates Agreement (1995-1998)
• Prof. partim at the University of Louvain, Convention ULB-UCL (1993-2000)
• Since 2015 : Member of Comité éditorial de la Revue Géologie de la France http://geolfrance.brgm.fr
• Since 2014 : Regular author of texts for ‘la Revue Science et Pseudosciences’ http://www.pseudo-sciences.org/
• Many field works (several weeks to 2 months) (Meso- and Paleozoic carbonates, Paleo- to Neoproterozoic carbonates) in Europe, USA (Nevada), Papouasia (Holocene), North Africa (Algeria, Morrocco, Tunisia), West Africa (Gabon, DRC, Congo-Brazzaville, South Africa, Angola), Iraq... Recently : field works (3 to 5 weeks) Congo- Brazzaville 2012, 2015, 2016 (carbonate Neoproterozoic).
Degree in geological sciences at the Free University of Brussels (ULB) in 1974, I went to Algeria for two years teaching mining geology at the University of Constantine. Back in Belgium I worked for two years as an expert for the EEC (European Commission), first on the prospecting of Pb and Zn in carbonate environments, then the uranium exploration in Belgium. Then Assistant at ULB, Department of Geology I got the degree of Doctor of Sciences (Geology) in 1985. My thesis, devoted to the study of the Devonian carbonate sedimentology of northern France and southern Belgium, comprised a significant portion of field work whose interpretation and synthesis conducted to the establishment of model of carbonate platforms and ramps with reefal constructions.
I then worked for Petrofina SA and shared a little more than two years in Angola as Director of the Research Laboratory of this oil company. The lab included 22 people (micropaleontology, sedimentology, petrophysics). My main activity was to interpret facies reservoirs from drillings in the Cretaceous, sometimes in the Tertiary. I carried out many studies for oil companies operating in this country.
I returned to the ULB in 1988 as First Assistant and was appointed Professor in 1990. I carried out various missions for mining companies in Belgium and oil companies abroad and continued research, particularly through projects of the Scientific Research National Funds (FNRS).
My research still concerns sedimentology, geochemistry and diagenesis of carbonate rocks which leads me to travel many countries in Europe or outside Europe, North Africa, Papua New Guinea and the USA, to conduct field missions.
Since the late 90's, I expanded my field of research in addressing the problem of mass extinctions of organisms from the Upper Devonian series across Euramerica (from North America to Poland) and I also specialized in microbiological and geochemical analyses of ancient carbonate series developing a sustained collaboration with biologists of my university. We are at the origin of a paleoecological model based on the presence of iron-bacterial microfossils, which led me to travel many countries in Europe and North Africa. This model accounts for the red pigmentation of many marble and ornamental stones used in the world. This research also has implications on the emergence of Life from the earliest stages of formation of Earth, as well as in the field of exobiology or extraterrestrial life ...
More recently I invested in the study from the Precambrian series of Gabon and Congo. These works with colleagues from BRGM (Orléans) are as much about the academic side (consequences of the appearance of oxygen in the Paleoproterozoic and study of Neoproterozoic glaciations) that the potential applications in reservoir rocks and source rocks of oil (in collaboration with oil companies).
Finally I recently established a close collaboration with the Royal Institute of Natural Sciences of Belgium to study the susceptibility magnetic signal from various European Paleozoic series. All these works allowed me to gain a thorough understanding of carbonate rocks (petrology, micropaleontology, geobiology, geochemistry, sequence stratigraphy, diagenesis) as well in Precambrian (2.2 Ga and 0.6 Ga), Paleozoic (from Silurian to Carboniferous) and Mesozoic (Jurassic and Cretaceous) rocks. Recently (2010) I have established a collaboration with Iraqi Kurdistan as part of a government program to boost scientific research in this country.
My research led me to publish about 180 papers in international and national journals and presented more than 170 conference papers. I am a holder of eight courses at the ULB (5 mandatory and 3 optional), excursions and field stages, I taught at the third cycle in several French universities and led or co-managed a score of 20 Doctoral (PhD) and Post-doctoral theses and has been the promotor of more than 50 Masters theses.
New research disputes a long-held view that our earliest tool-bearing ancestors contributed to the demise of large mammals in Africa over the last several million years. Instead, the researchers argue that long-term environmental change drove the extinctions, mainly in the form of grassland expansion likely caused by falling atmospheric carbon dioxide (CO2) levels.
The study is published today in the journal Science.
“Despite decades of literature asserting that early hominins impacted ancient African faunas, there have been few attempts to actually test this scenario or to explore alternatives,” Faith says. “We think our study is a major step towards understanding the depth of anthropogenic impacts on large mammal communities, and provides a convincing counter-argument to these long-held views about our early ancestors.”
To test for ancient hominin impacts, the researchers compiled a seven-million-year record of herbivore extinctions in eastern Africa, focusing on the very largest species, the so-called ‘megaherbivores’ (species over 2,000 lbs.) Though only five megaherbivores exist in Africa today, there was a much greater diversity in the past. For example, three-million-year-old ‘Lucy’ (Australopithecus afarensis) shared her woodland landscape with three giraffes, two rhinos, a hippo, and four elephant-like species at Hadar, Ethiopia.
One of the most basic things about journalism, especially BBC journalism, is that anyone should be able to find out what the corporation reported on a particular day about a particular story. Imagine wanting to find out about what Parliament voted for or what was the content of a UN speech, or the conclusions of a report, and not having full confidence that what you are able to look up is what was actually broadcast or written.
The public does not have access to data held in TV and Radio News archives, but they do to the articles published by BBC News Online. Sadly if you want to know what article was published about a certain subject on a particular day you cannot be sure the BBC Online News website is telling you the truth for history might have been rewritten 1984 style if recent antics in its Environment section are anything to go by.
A number of environmental groups in Canada and other countries have recently endorsed the “100% Clean and Renewable Wind, Water and Sunlight (WWS)” vision articulated in reports written by MarkJacobson, Mark Delucci and others. This vision seeks to eliminate the use of all fossil fuels (coal, oil and natural gas) in the world by 2050. Jacobson, Delucci et. al. have published “all-sector energy roadmaps”in which they purport to show how each of 139 countries could attain the WWS goal. The purpose of this paper is to examine whether the 100% goal is feasible.
While a range of renewable energy technologies (e.g. geothermal, hydroelectric, tidal, and wave energy) could play a role in the global transformation, the world foreseen in the WWS vision would be dominated by wind and solar energy. Of 53,535 gigawatts (GW) of new electrical energy generation sources to be built, onshore and offshore wind turbines would supply 19,000 GW (35.4%), solar photovoltaic (PV) plants would supply 17,100 GW (32%) and Concentrated Solar Power plants (CSP) would supply 14,700 GW (27.5%). This would cost $100 trillion, or $3,571 for every household on the planet.
What do you think are the biggest challenges right now in your field?
Some of the challenges are too hard for me even to pursue them. In the climate world, we don’t know about the role of clouds. And I don’t know how to pursue this, so I don’t pursue it. Do clouds have a cooling effect, and what is the response from clouds to warming? Will they slow or accelerate the warming? We don’t know. The role of clouds is certainly a big, big question. Although I do not work on this, I think about it, but I don’t see what to do.
One of the problems I do work on is what brought us Ice Ages. How did we go through 300 My years without much ice in the northern hemisphere and then suddenly, beginning 3My years ago or so, we had 5 big Ice Ages? Why? An easy answer is that now CO2 is higher. But it’s really hard to measure, determining CO2 in the past is a big question.
Another big question for me is how does the convection in the mantle connect with deformation in the lithosphere? How do these connect to one another?
by Paul Berth, 22 novembre 2018, in ScienceClimatEnergie
Les microbulles de gaz emprisonnées dans les carottes de glace sont fréquemment utilisées pour estimer le taux de CO2 de l’atmosphère du passé. Il s’agit de méthodes de mesure indirectes. Par exemple la carotte de glace EPICA Dome C en Antarctique nous suggère que le CO2 de l’atmosphère a varié entre 180 et 300 ppmv pendant les derniers 650 000 ans (Brook 2005). Cependant, le taux de CO2 observé dans ces carottes de glace représente-il vraiment l’atmosphère du passé? Nous allons montrer ici qu’un paramètre est souvent négligé par les glaciologues, et que ce paramètre pourrait avoir un effet considérable sur le résultat des analyses : il s’agit de la présence de micro-organismes dans la glace et les microbulles.
The evidence that “global” warming has not been global in scale continues to accumulate. Two more new reconstructions from the Western Pacific (He et al., 2018) and subpolar North Atlantic (Orme et al., 2018) indicate that modern temperatures have continued to decline since the onset of the Little Ice Age.
These add to the nearly 300 graphs published in the scientific literature since 2017 showing that there is nothing unusual, unprecedented, or remarkable about the temperatures changes in the last 150 years.
The Camp Fire that struck the northern California town of Paradise and vicinity is a profoundly disturbing environmental disaster of first magnitude. Nearly 100 people have lost their lives, approximately 10,000 homes have been lost, a major community has essentially been destroyed, and millions of people have been exposed to high concentrations of smoke. Tens of thousands of people have been displaced and lives of millions substantially affected.
And beyond the heart-wrenching losses noted above, it is doubly tragic that this disaster was both foreseeable and avoidable, resulting from a series of errors, poor judgment, lack of use of available technology, and poor urban planning.
It is more than unfortunate that some politicians, environmental advocacy groups, and activist scientists are attempting to use this tragedy as a tool for their own agenda, make the claim that the Camp Fire was result of global warming.
The Lancaster university-led research, which is featured in Scientific Reports, is the first published field study to show methane release from glaciers on this scale.
“This is a huge amount of methane lost from the glacial meltwater stream into the atmosphere,” said Dr Peter Wynn, a glacial biogeochemist from the Lancaster Environment Centre and corresponding author of the study. “It greatly exceeds average methane loss from non-glacial rivers to the atmosphere reported in the scientific literature. It rivals some of the world’s most methane-producing wetlands; and represents more than twenty times the known methane emissions of all Europe’s other volcanoes put together.”
In the climate alarmists’ worldwide crusade against carbon dioxide gas, only the most delusional still believe that wind and solar power add anything to their arsenal.
As we have said repeatedly, nuclear power is the only stand-alone power generation source which is capable of delivering power on demand, without CO2 emissions being generated in the process.
Perversely, notwithstanding that Australia is in the top three uranium exporters, it’s the only G20 country with a legislated prohibition on nuclear power generation…
A few news items from The Shale Gas News, by Bill desRosiers of Cabot Oil & Gas. The main paragraphs below are adapted from desRosiers, but I’ve added some detail. Things are looking very good for the U.S. oil, gas and coal industries.
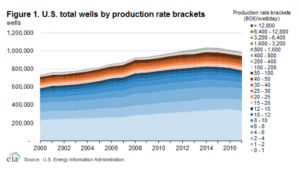
U.S. crude oil and natural gas production increased in 2017, with fewer wells. The total number of wells producing crude oil and natural gas in the United States fell to 991,000 in 2017, down from a peak of 1,039,000 wells in 2014. This recent decline in the number of wells reflects advances in technology and drilling techniques. EIA’s updated U.S. Oil and Natural Gas Wells by Production Rate report shows how daily production rates of individual wells contributed to U.S. total crude oil and natural gas production in 2017.
The well efficiency gains, in part, reflect an increase in the proportion of horizontal wells. The number of vertical wells decreased from 940,000 in 2014 to 864,000 in 2017. The number of horizontal wells increased from 99,000 in 2014 to 127,000 in 2017, an increase of 28%. This is important since only one percent of vertical wells produce 100 barrels of oil per day (BOPD) or more, but 30% of horizontal wells do. Typically, a horizontal well costs about twice as much as a vertical well to the same reservoir.
U.S. oil production grew from 10 million BOPD to 11 million BOPD between December 2017 and July 2018. Over the same period natural gas production grew from 97 BCF (billion cubic feet) to 100 BCF. Figures 1, 2, and 3 show the total number of wells drilled and the total oil and natural gas production.
Reflections on Nic Lewis’ audit of the Resplandy et al. paper.
In response to Nic Lewis’ two blog posts critiquing the Resplandy et al. paper on ocean temperatures, co-author Ralph Keeling acknowledges the paper’s errors with these statements:
…
Conclusions
By quickly admitting mistakes and giving credit where due, Ralph Keeling has done something unusual and laudatory in the field of climate science. If all climate scientists behaved this way, there would be no ‘hostile environment.’
I find it to be a sad state of affairs when a scientist admitting mistakes gets more kudos than the scientist actually finding the mistakes. But given the state of climate science, I guess finding mistakes seems to be a more common story than a publishing scientist actually admitting to mistakes.
Given the importance of auditing climate research and independent climate scientists working outside of institutional frameworks, I wish there was some way to encourage more of this. In the absence of recognition and funding, I don’t have much to suggest
Their study in the journal Geophysical Research Letters is based on an analysis of fossil signatures from deep ocean sediments, the magnetic signature of oceanic crust and the position of the mantle “hot spot” that created the Hawaiian Islands. Co-authors Richard Gordon and Daniel Woodworth said the evidence suggests Earth spun steadily for millions of years before shifting relative to its spin axis, an effect geophysicists refer to as “true polar wander.”
“The Hawaiian hot spot was fixed, relative to the spin axis, from about 48 million years ago to about 12 million years ago, but it was fixed at a latitude farther north than we find it today,” said Woodworth, a graduate student in Rice’s Department of Earth, Environmental and Planetary Sciences. “By comparing the Hawaiian hot spot to the rest of the Earth, we can see that that shift in location was reflected in the rest of the Earth and is superimposed on the motion of tectonic plates. That tells us that the entire Earth moved, relative to the spin axis, which we interpret to be true polar wander.”
Not all polar bears are in the same dire situation due to retreating sea ice, at least not right now. Off the western coast of Alaska, the Chukchi Sea is rich in marine life, but the number of polar bears in the area had never been counted. The first formal study of this population suggests that it’s been healthy and relatively abundant in recent years, numbering about 3,000 animals.
The study by researchers at the University of Washington and federal agencies is published Nov. 14 in Scientific Reports, an open-access journal from the Nature Publishing Group.
“This work represents a decade of research that gives us a first estimate of the abundance and status of the Chukchi Sea subpopulation,” said first author Eric Regehr, a researcher with the UW’s Polar Science Center who started the project as a biologist in Alaska with the U.S. Fish and Wildlife Service. “Despite having about one month less time on preferred sea ice habitats to hunt compared with 25 years ago, we found that the Chukchi Sea subpopulation was doing well from 2008 to 2016.
Over 8,000 homes and businesses have been reduced to ashes and rubble by the latest California conflagrations. Well over 60 people have perished, over 50,000 are homeless, hundreds remain missing. “This is the new abnormal,” Governor Jerry Brown insists. “Dryness, warmth, drought, all those things are going to intensify,” because of climate change. Even if we do more on forest management, that won’t stop climate change. “And those who deny that are definitely contributing to the tragedies.”
Those assertions have no basis in fact. The hard, incontrovertible reality is that California has always been a largely arid state, afflicted by prolonged droughts, interspersed with periods of intense rainfall, and buffeted almost every autumn by strong winds that can whip forest fires into infernos. The problem isn’t climate change. It’s ideological, even criminally incompetent forest management practices demanded by politicians, regulators, judges and environmentalists in recent decades. My article presents the real story.
Let me start explaining the link from Picasso to climate science by looking at what Dr. Nir Shaviv called “the most boring graph I have ever plotted in my life”.
This is the graph of the changes in the best estimate of the range of what is called “climate sensitivity” over the last forty years or so.
What is climate sensitivity when it’s at home? To explain that, I’ll have to take a slight detour. First, downwelling radiation.
“Downwelling” in climate science means headed down towards the planetary surface. Downwelling radiation is the total radiation going downwards towards the surface. It is composed of sunshine (shortwave) plus thermal radiation from the atmosphere (longwave). In climate science, this quantity, total downwelling radiation, is called “forcing”, abbreviated “F”
The central paradigm of modern climate science is that if you change the amount of downwelling radiation (forcing), that the surface temperature perforce will change. The claim is that everything else averages out, and if the forcing increases, then surface temperature needs to change to maintain the global energy balance. It has to change. It must.
In short, the central paradigm of modern climate science is the following:
In the long run, global temperature change is proportional to global forcing change.
The putatively constant proportion between the two, which is the temperature change divided by forcing change, is called the “climate sensitivity”.
A new study by The University of Texas at Austin has demonstrated a possible link between life on Earth and the movement of continents. The findings show that sediment, which is often composed of pieces of dead organisms, could play a key role in determining the speed of continental drift. In addition to challenging existing ideas about how plates interact, the findings are important because they describe potential feedback mechanisms between tectonic movement, climate and life on Earth.
The study, published Nov. 15 in Earth and Planetary Science Letters, describes how sediment moving under or subducting beneath tectonic plates could regulate the movement of the plates and may even play a role in the rapid rise of mountain ranges and growth of continental crust
Ask medieval historian Michael McCormick what year was the worst to be alive, and he’s got an answer: “536.” Not 1349, when the Black Death wiped out half of Europe. Not 1918, when the flu killed 50 million to 100 million people, mostly young adults. But 536. In Europe, “It was the beginning of one of the worst periods to be alive, if not the worst year,” says McCormick, a historian and archaeologist who chairs the Harvard University Initiative for the Science of the Human Past.
A mysterious fog plunged Europe, the Middle East, and parts of Asia into darkness, day and night—for 18 months. “For the sun gave forth its light without brightness, like the moon, during the whole year,” wrote Byzantine historian Procopius. Temperatures in the summer of 536 fell 1.5°C to 2.5°C, initiating the coldest decade in the past 2300 years. Snow fell that summer in China; crops failed; people starved. The Irish chronicles record “a failure of bread from the years 536–539.” Then, in 541, bubonic plague struck the Roman port of Pelusium, in Egypt. What came to be called the Plague of Justinian spread rapidly, wiping out one-third to one-half of the population of the eastern Roman Empire and hastening its collapse, McCormick says.
WUWT has posted several excellent articles by Jim Steele on how global warming alarmism uses corals as the poster child for warming and acidifying oceans, none of which is scientifically justified. A brief review follows, calling attention to a recently discovered additional adaptation mechanism not covered AFAIK by Jim Steele’s posts. The motivation for this post was triggered by a recent lunch with newish neighbor Charles the Moderator (CtM), and his sharing many wonderful underwater photographs of the coral reef he now dives frequently off Pompano Beach (same reef system as off Fort Lauderdale, just a few miles further north and more conveniently onshore).
by P. Homewood, November 17, 2018 in NotalotofPeopleKnowThat
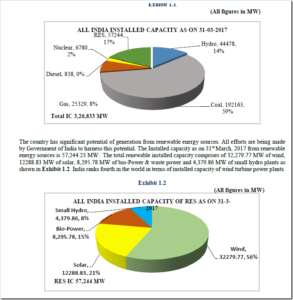
It’s worth taking a closer look at the claim made last week that India is leading the world in tackling climate change.
The claim was based on India’s latest National Electricity Plan (NEP), which was published in April 2018. Below is the current situation for installed capacity, according to the NEP:
D’abord cette info surprenante. Une étude récente sur le réchauffement des océans a dû être modifiée après publication dans Nature. L’étude, très alarmiste, avait pourtant été révisée puis validée par un comité de lecture et publiée dans la plus prestigieuse revue scientifique au monde. Or la méthodologie et les conclusions de cette recherche étaient erronées.
…
La faille a été découverte par Nic Lewis, un chercheur climato-critique très populaire en Grande-Bretagne. Il affirme, et les faits lui donnent raison: « Je suis légèrement surpris que ni les pairs examinateurs ni le rédacteur en chef n’aient repéré ce qui me semblait être une alarme rouge à la page 1. »
Since 2000, the world has doubled its coal-fired power capacity to 2,000 gigawatts (GW) after explosive growth in China and India. Another 200GW is being built and 450GW is planned.
More recently, 200GW has closed due to a wave of retirements across the EU and US. Another 170GW is set to retire by 2030 and 13 of the world’s 77 coal-powered countries plan a total phaseout.
Meanwhile, electricity generated from coal peaked in 2014, so the expanding fleet is running fewer hours than ever. This erodes coal’s bottom line, as does competition from gas and renewables.
The way coal’s next chapter unfolds is key to tackling climate change. All unabated coal must close within a few decades if warming is to be limited to less than 2C above pre-industrial temperatures, according to the International Energy Agency (IEA).
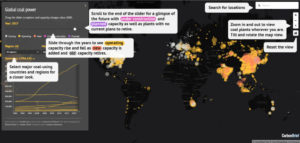
To shed light on this story, Carbon Brief has mapped the past, present and future of all the world’s coal-fired power stations. The interactive timeline map, above, shows the plants operating in each year between 2000 and 2017, as well as the location of planned new capacity.
Using data from CoalSwarm’sGlobal Coal Plant Tracker, it features around 10,000 retired, operating and planned coal units, totalling nearly 3,000 gigawatts (GW) across 95 countries.
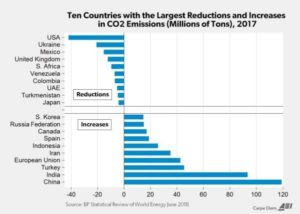
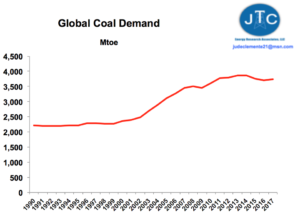
Even with the Paris climate accords signed in late-2015, global coal demand in 2017 rose for the first time in two years, as reported by the Paris-based International Energy Agency during its annual World Energy Outlook release week.
…
Global coal use increased in 2017, despite claims it is “dying.”DATA SOURCE: BP; JTC
As you’ll soon see, there was an eye-catching uptick (+0.25 deg C) in the GISS global Land-Ocean Temperature Index (LOTI) data from September to October 2018. We’ll have to wait for next month’s update to see if it also appears in the NOAA and Met Office datasets.
…
Figure 8
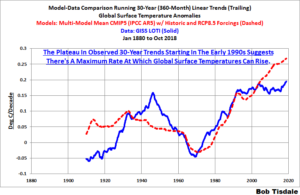
There are numerous things to note in the trend comparison. First, there is a growing divergence between models and data starting in the early 2000s. The continued rise in the model trends indicates global surface warming is supposed to be accelerating, but the data indicate little to no acceleration since then. Second, the plateau in the data warming rates begins in the early 1990s, indicating that there has been very little acceleration of global warming for more than 2 decades. This suggests that there MAY BE a maximum rate at which surface temperatures can warm. Third, note that the observed 30-year trend ending in the mid-1940s is comparable to the recent 30-year trends. (That, of course, is a function of the new NOAA ERSST.v5 data used by GISS.) Fourth, yet that high 30-year warming ending about 1945 occurred without being caused by the forcings that drive the climate models. That is, the climate models indicate that global surface temperatures should have warmed at about a third that fast if global surface temperatures were dictated by the forcings used to drive the models. In other words, if the models can’t explain the observed 30-year warming ending around 1945, then the warming must have occurred naturally. And that, in turns, generates the question: how much of the current warming occurred naturally? Fifth, the agreement between model and data trends for the 30-year periods ending in the 1960s to about 2000 suggests the models were tuned to that period or at least part of it. Sixth, going back further in time, the models can’t explain the cooling seen during the 30-year periods before the 1920s, which is why they fail to properly simulate the warming in the early 20thCentury.
One last note, the monumental difference in modeled and observed warming rates at about 1945 confirms my earlier statement that the models can’t simulate the warming that occurred during the early warming period of the 20th Century.
The year 2018 could mark the beginning of the end of climate change alarmist reporting. Projections of catastrophic melting of the ice sheets and sea level rise swallowing up the Earth’s coasts are increasingly undermined by observation.
…
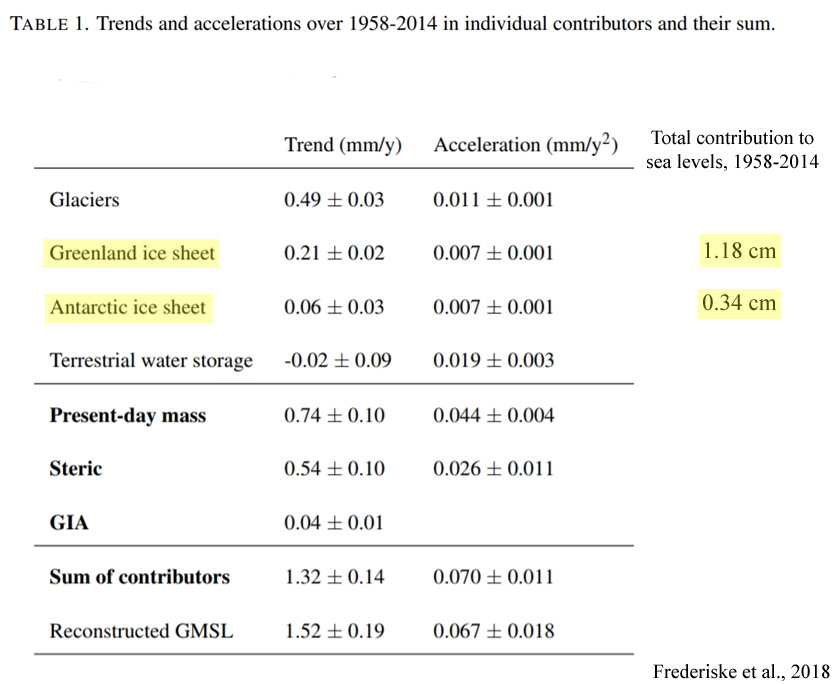
Despite the hackneyed practice of reporting “staggering” ice sheet melt for both Greenland and Antarctica in recent decades, the two polar ice sheets combined to add just 1.5 centimeters to sea level rise between 1958 and 2014 (graphfrom Frederikse et al., 2018) as global sea levels only rose by “1.5 ± 0.2 mm yr−1 over 1958–2014 (1σ)” or “1.3 ± 0.1 mm yr−1 for the sum of contributors”.
That’s about 7.8 centimeters (3.1 inches) of global sea level change in 56 years.
…
La géologie, une science plus que passionnante … et diverse
