Archives de catégorie : climate-debate

“Likelihood Of A Sub-Cooled Summer For Europe In 2021”, Hale Solar Cycle Suggests

by Dr Ludger Laurenz, May 30, 2021, in NoTricksZone


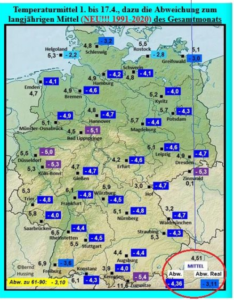
So far, much of Europe has seen a cold and wet 2021. It may be related to solar cycles. 

An essay at Die kalte Sonne by Dr. Ludger Laurenz looks at the relationship between solar activity and weather trends, and believes this summer’s temperature will be 1.5°C lower.

There are many scientific opinions about solar activity’s impact on weather and climate, which differ and contradict each other. For example, a new publication by Leamon et al. provides an important building block for uncovering solar influence. Background here.

Solar influence in historical climate data substantiated

In the Leamon et al publication, the authors looked at the 22-year Hale solar cycles and saw it is possible to detect and substantiate solar influence in historical climate data (from tropical ocean surface temperature to temperature, sunshine, and precipitation data) and to make quantitative statements about the influence of solar activity on weather data.

Norway winter temperature and sun: “high statistical significance”

“Using the alternating years between Hale cycles, a correlation between the 22-year Hale cycle of the Sun and the trend of winter temperature in the polar night of Norway can be demonstrated with high statistical significance,” Dr Laurenz adds.

“Parallel to the temperature trend, the solar influence of the Hale cycles is also evident in the index values of the North Atlantic and Arctic Oscillations,” says Laurenz  in addition. “Evidence of the influence of solar activity in the polar night of Scandinavia demonstrates that differences in solar activity are transmitted to the near-surface temperature via amplification mechanisms such as change in circulation patterns in the North Atlantic and Arctic Oscillations.”

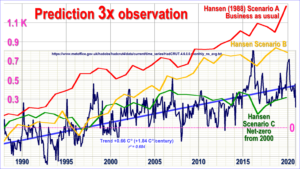
The sun’s role in weather patterns is a great significance, and so CO2 is not the main driver at all.

CO2 Cyclone Doomsday Flat Out Refuted: 170 Years “Absolutely No Trend” In Hurricane Intensity/Frequency

by P. Gosselin, May, 22, 2021 in NoTricksZone


The latest comes from statistics expert, Zoe Phin, who looks at the alarmists’ claim that increasing CO2 emissions are leading to more frequent and intense Atlantic hurricanes.

Alarmist claims cost nothing, and so easily made. Zoe Phin looks at whether the hurricane alarmist claim holds up.

Frequency

First Zoe looked at the (HURDAT2) data to find out if the first of the two claims (increasing frequency) is true. At first glance it would appear so.

But Zoe asks if the method of measuring the frequency really is sensible and if it maybe weren’t better to measure the amount of time the Atlantic spends in hurricane mode? To find out, Zoe plotted the hurricane hours data and the 10-year moving average:

Source: Zoe Phin.

….

New Study Casts Doubt On Controversial Theory Linking Melting Arctic To Severe Winter Weather

by P. Voosen, May 13, 2021 in ClimagteChangeDispatch


Every time severe winter weather strikes the United States or Europe, reporters are fond of saying that global warming may be to blame.

The paradox goes like this: As Arctic sea ice melts and the polar atmosphere warms, the swirling winds that confine cold Arctic air weaken, letting it spill farther south.

But this idea, popularized a decade ago [and was the outlandish plotline in The Day After Tomorrow, pictured], has long faced skepticism from many atmospheric scientists, who found the proposed linkage unconvincing and saw little evidence of it in simulations of the climate.

Now, the most comprehensive modeling investigation into this link has delivered the heaviest blow yet: Even after the massive sea ice loss expected by midcentury, the polar jet stream will only weaken by tiny amounts—at most only 10% of its natural swings.

And in today’s world, the influence of ice loss on winter weather is negligible, says James Screen, a climate scientist at the University of Exeter and co-leader of the investigation, which presented its results last monthat the annual meeting of the European Geosciences Union.

The Greenhouse Effect In A Water World

by B. Irvine, May 17, 2021 in WUWT


A knowledge of Greenhouse gases is fundamental to any understanding of global surface temperatures. The presence of GHGs in our atmosphere has increased the global surface temperature by about 33C.

There are multiple lines of evidence, however, that challenge the strong water vapour feedback to a small initial CO2 forcing.  These strong positive feedbacks are central to the IPCC narrative.

These lines of evidence include.

  • The failure of all models and catastrophic warming projections.
  • The stubborn refusal of atmospheric Precipitable Water Vapour (PWV) concentration to rise in recent years.
  • The strength of convection cells in the tropics that have kept tropical temperatures approximately the same for many millions of years.
  • Irrigation and extra humidity generally coincide with cooler temperatures.
  • The hot spot as a signature of the positive Water Vapour (WV) feedback and its opposite, the negative lapse rate feedback, has not occurred.

INTRODUCTION

German Professor: Climate Model Deviation From Observations “Striking”…”Politically Significant”

by P. Gosselin, May 8, 2021 in NoTricksZone


At Die kalte Sonne, Prof. Fritz Vahrenholt – one of the founders of Germany’s modern environmental movement – presents his monthly summary, which includes a look at global temperature and how the models are doing.

The global mean temperature deviation of satellite-based measurements from the mean of the 1991 – 2020 period was -0.05 degrees Celsius in April 2021. Nevertheless, German courts have ruled that something has got to be done about the warming planet!

Global temperature curve in April 2021

The cool La Niña situation over the recent months is still having an effect. According to the U.S. National Oceanic and Atmospheric Administration (NOAA), there is an 80% probability that La Niña will end between May and July. However, the agency expects a new La Niña to begin again in the fall.

The average temperature increase has been 0.14 degrees Celsius per decade. The model calculations, on which the IPCC’s recommendations are based, come up with a temperature increase that is twice as high for the same period (see chart below, source: R. Spencer 2021).

This striking deviation from the real temperature development is politically significant, because model forecasts are the basis for far-reaching decisions, such as constitutional court rulings.”

COSMIC RAY FLUX AND GLOBAL COOLING: THE IMPLICATIONS ARE UPON US

by Cap Allon, Apr 30, 2021 in Electroverse


GALACTIC Cosmic Rays are a mixture of high-energy photons and sub-atomic particles accelerated toward Earth by supernova explosions and other violent events in the cosmos, while SOLAR Cosmic Rays are effectively the same, only their source is the Sun.

Spaceweather.com and the students of Earth to Sky Calculus have been launching cosmic ray balloons almost weekly since March 2015–before the pandemic threw a spanner in. The team’s published results reveal that atmospheric radiation reached record highs just as solar activity hit a new space age low — the correlation is clear for all to see, with additional proxy data revealing it has been the case for time-immemorial.

During solar minimums –the low point of the 11 year solar cycle– the Sun’s magnetic field weakens and the outward pressure of the solar wind decreases. This allows more cosmic rays (CRs) to penetrate the inner solar system, including our planet’s atmosphere:

Cosmic Rays correlating with Sunspots.

IT’S GETTING HARDER AND HARDER TO MAINTAIN THE LIE: GLOBAL TEMPERATURES SINK FURTHER IN APRIL

by Cap Allon, May,  3, 2021, in Electroverse


The Version 6.0 global average lower tropospheric temperature (LT) anomaly for April, 2021 has come in at -0.05 deg. C, sinking further below the 30-year baseline down from the March, 2021 value of -0.01 deg. C, and down substantially (approx. 0.65C deg. C) from where we were around a year ago…

…in other words, it is get harder and harder for the politicized ‘catastrophic global heating’ narrative to be maintained. But as Gustave Le Bo writes: “The masses have never thirsted after truth. They turn aside from evidence that is not to their taste, preferring to deify error, if error seduces them. Whoever can supply them with illusions is easily their master; whoever attempts to destroy their illusions is always their victim.”

A continuation of this downward plunge is probable over the coming months (with the odd bump along the way–climate is cyclic after all) as low solar activity and La Nina conditions continues to influence our climate.

According to the 15x NASA/NOAA AMSU satellites that measure every square inch of the lower troposphere (where us humans reside), planet Earth was actually warmer back in 1980:

Solar Cycle 25 may have finally started stirring (see link below), but sunspots (a great barometer for solar activity) look set to closely track the forecasts: i.e., the cycle is due to be another weak one, similar in vein to the cycle just gone (24), which will continue the global cooling trend that is now firmly established.

19th century glacier retreat in the Alps preceded the emergence of industrial black carbon deposition on high-alpine glaciers

by M. Sigl et al., Jan 8, 2018 in TheCryosphere


Starting around AD 1860, many glaciers in the European Alps began to retreat from their maximum mid-19th century terminus positions, thereby visualizing the end of the Little Ice Age in Europe. Radiative forcing by increasing deposition of industrial black carbon to snow has been suggested as the main driver of the abrupt glacier retreats in the Alps. The basis for this hypothesis was model simulations using elemental carbon concentrations at low temporal resolution from two ice cores in the Alps.

Here we present sub-annually resolved concentration records of refractory black carbon (rBC; using soot photometry) as well as distinctive tracers for mineral dust, biomass burning and industrial pollution from the Colle Gnifetti ice core in the Alps from AD 1741 to 2015. These records allow precise assessment of a potential relation between the timing of observed acceleration of glacier melt in the mid-19th century with an increase of rBC deposition on the glacier caused by the industrialization of Western Europe. Our study reveals that in AD 1875, the time when rBC ice-core concentrations started to significantly increase, the majority of Alpine glaciers had already experienced more than 80 % of their total 19th century length reduction, casting doubt on a leading role for soot in terminating of the Little Ice Age. Attribution of glacial retreat requires expansion of the spatial network and sampling density of high alpine ice cores to balance potential biasing effects arising from transport, deposition, and snow conservation in individual ice-core records.

The Supermoon and SLR

by Kip Hansen, Apr 30, 2021 in WUWT


Dr. Judith Curry sent out a tweet about this article at The Conversation:  “This supermoon has a twist – expect flooding, but a lunar cycle is masking effects of sea level rise“.  The piece is written by Brian McNoldy, a Senior Research Associate, University of Miami and written in conjunction with Covering Climate Now — the climate news propaganda effort headed up by the Columbia Journalism Review and The Guardian.  The Conversation is a member of Covering Climate Now  and a search of their website shows they have published, so far, a total of 86 articles in cooperation with that organization.

McNoldy does a good job explaining what Lunar Nodal Cycle is and how it affects apparent local Relative Sea Level Rise

Bottom Line:

Miami, Florida has high tide flooding because much of Miami Beach (particularly) is built within a foot or two of normal high tides, and some portions are below normal high tides.  So, of course, Miami will experience tidal flooding again at these predicted higher tides.  For Miami’s real Sea Level story, see my earlier essay:  Miami’s Vice.

Oceanic Warming? Well, sorta.

by W. Eschenbach, May 1, 2021 in WUWT


After my last post about the surface warming of the ocean, entitled “How Global Warming Isn’t“, I got to thinking about the warming of the upper part of the ocean. So I got the data for the ocean heat content (OHC) of the top 700 metres of the ocean from the marvelous site, KNMI. If you look under “Monthly Observations” you’ll find a host of most fascinating datasets. Under “Heat Content” on that page, you’ll find the National Oceanic Data Center (NODC) 0-700 metre depth OHC data. And down at the very bottom of that page is a link that will download a 196 megabyte gridded NetCDF file containing the data that I used. (Big file, click at your own risk.)

And what did I find? Well, I’m a visual kind of guy. I mean, I can do the math, but it only makes sense when it comes up as a picture on the silver screen. So here are my graphics. I’m interested in the changes in the oceanic heat content, so these are two views of those trends.

This is the bottom line. If the world’s creatures, both on land and at sea, were as temperature-sensitive as the alarmists would have us believe, those beings (and we humanoids as well) all would have gone extinct long ago. And near as I can tell, that hasn’t occurred … at least yet.

Gavin’s Falsifiable Science

by W. Eschenbach, Apr 2020 in WUWT


Gavin Schmidt is a computer programmer with the Goddard Institute of Space Sciences (GISS) and a noted climate alarmist. He has a Ph.D. in applied mathematics. He’s put together a twitter threadcontaining what he sees as some important points of the “testable, falsifiable science that supports a human cause of recent trends in global mean temperature”. He says that the slight ongoing rise in temperature is due to the increase in carbon dioxide (CO2) and other so-called “greenhouse gases”. For simplicity, I’ll call this the “CO2 Roolz Temperature” theory of climate. We’ve discussed Dr. Schmidt’s ideas before here on WUWT.

Now, Gavin and I have a bit of history. We first started corresponding by way of a climate mailing list moderated by Timo Hameraanta back around the turn of the century, before Facebook and Twitter.

The interesting part of our interaction was what convinced me that he was a lousy programmer. I asked him about his program, the GISS Global Climate Model. I was interested in how his model made sure that energy was conserved. I asked what happened at the end of each model timestep to verify that energy was neither created nor destroyed.

He said what I knew from my own experience in writing iterative models, that there is always some slight imbalance in energy from the beginning to the end of the timestep. If nothing else, the discrete digital nature of each calculation assures that there with be slight roundoff errors. If these are left uncorrected they can easily accumulate and bring the model down.

He said the way that the GISS model handled that imbalance was to take the excess or the shortage of energy and sprinkle it evenly over the entire planet.

Now, that seemed reasonable for trivial amounts of imbalance coming from digitization. But what if it were larger, and it arose from some problem with their calculations? What then?

So I asked him how large that energy imbalance typically was … and to my astonishment, he said he didn’t know.

Amazed, I asked if he had some computer version of a “Murphy Gauge” on the excess energy. A “Murphy Gauge” (below) is a gauge that allows for Murphy’s Law by letting you set an alarm if the variable goes outside of the expected range … which of course it will, Murphy says so. On the computer, the equivalent would be something in his model that would warn him if the excess or shortage of energy exceeded some set amount.

POLAR CHILL GRIPS NEW ZEALAND + ANTARCTIC SEA ICE EXTENT HOLDING ABOVE 1979-1990 AVERAGE

by Cap Allon, Apr 28, 2021 in Electroverse


Winter is arriving early across New Zealand, particularly in the South Island where well-below average temperatures and even a dusting of out-of-season snow have set in.

A midnight snowstorm delivered a healthy dumping to the Porters Alpine Resort near Castle Hill Tuesday morning, while parts of inland Canterbury and Otago woke to freezing temperatures, down to -3.2C.

The mercury had plunged even further by Wednesday morning, as an Antarctic air mass took charge.

The conditions led to a hard, widespread frost, according to stuff.co.nz, one that stretched from the Canterbury region down to the Lakes District, and beyond.

Lows of -5.1C and -6.4C were registered at Mackenzie Basin and a MetService weather station near Twizel, respectively — also note, Twizel’s low of -6.2C is some 8.8C below the average for the time of year.

Other South Island locales to report freezing temperatures included Lauder, which dropped to -2.7C; Ranfurly with -3.1C; Alexandra with -2.3C; and Mount Cook Village, which registered -1.9C.

A few negative readings were logged in the North Island, too: a weather station near Waiouru dipped down to -0.7C early Wednesday morning.

With regards to the snow, it has for now been restricted to the highest elevations; however, Porters operations manager Blair James believes the recent cold snap –which he says has brought snow and well-below average cold for the past two weeks now– could be an early indicator of a good snowfall season to come.

The below photo was snapped at Mt. Hutt on Wednesday.

The resort, according to @SnowForecast on Twitter, had just received “more pre-season snowfall.”

EIA: U.S. CO2 Emissions Declined 11% in 2020 – No Change in Rising Atmospheric Carbon Dioxide

by Anthony Watts, Apr 10, 2021 in WUWT


Climate change action proponents regularly tell us we have to reduce our carbon dioxide (CO2) emissions to prevent “climate change”, even to the point of curtailing industry, travel, and food consumption. Fortunately, a real-world test of just those very things happened in 2020 due to the COVID-19 related lockdowns.

In a report released April 12th by the U.S. Energy Information Administration (EIA) the Monthly Energy Review, they report that energy-related CO2 emissions decreased by 11% in the United States in 2020 primarily because of the effects of the COVID-19 pandemic and related restrictions.

Furthermore, U.S. energy-related CO2 emissions fell in every end-use (consumer) sector for the first time since 2012. The EIA notes:

“CO2 emissions associated with energy use fell by 12% in the commercial sector in 2020. Part of this drop in emissions was due to pandemic restrictions. Because electricity is a large source of energy for the commercial sector, the declining carbon intensity of electric power also contributed to declining CO2emissions from commercial activity. Emissions from commercial electricity use fell by 13%. Commercial petroleum and natural gas emissions fell by 13% and 11%, respectively.”

“Within the U.S. power sector, emissions from coal declined the most, by almost a fifth, at 19%. Natural gas-related CO2 emissions rose by 3%. Also of note in 2020; fossil fuel generation declined, while power generation from renewables from wind and solar continued to grow.”


As seen in the graph above, CO2 in the atmosphere increased during 2020 during the economy crippling lockdowns at the same rate it has been for decades. There isn’t even a blip.

This lack of any reduction in atmospheric CO2 concentration clearly demonstrates that no matter how much the U.S. reduces CO2 emissions, no one living today will, at any point in life, see a measurable change in climate attributable to the reduction. This is especially true since other countries, such as China, who only give lip-service to the COemissions reduction demanded by the 2015 Paris Climate Accord.

The anatomy of past abrupt warmings recorded in Greenland ice

by C. Rotter, Apr 19, 2021 in WUWT/Nature


New paper at Nature Communications

Abstract

Data availability and temporal resolution make it challenging to unravel the anatomy (duration and temporal phasing) of the Last Glacial abrupt climate changes. Here, we address these limitations by investigating the anatomy of abrupt changes using sub-decadal-scale records from Greenland ice cores. We highlight the absence of a systematic pattern in the anatomy of abrupt changes as recorded in different ice parameters. This diversity in the sequence of changes seen in ice-core data is also observed in climate parameters derived from numerical simulations which exhibit self-sustained abrupt variability arising from internal atmosphere-ice-ocean interactions. Our analysis of two ice cores shows that the diversity of abrupt warming transitions represents variability inherent to the climate system and not archive-specific noise. Our results hint that during these abrupt events, it may not be possible to infer statistically-robust leads and lags between the different components of the climate system because of their tight coupling.

ENGLAND’S COLDEST APRIL SINCE 1922, GERMANY’S CHILLIEST SINCE 1917

by Cap Allon, Apr 20, 2021 in Elecroverse


It may be late-April, but spring 2021 is a no show across much of Europe.

The continent is suffering a climatic reality similar to that of the previous prolonged spell of reduced solar output: not since the Centennial Minimum (1880-1920) have Europeans suffered an April this cold and snowy.

ENGLAND’S COLDEST APRIL SINCE 1922

Despite the cherry-picking, the UHI-sidestepping, and the unrelenting propaganda, the British Isles simply won’t heat up — the UK’s agenda-shoveling Met Office has admitted as much themselves.

Recently, one of the Met Office’s key data sets revealed that the 2010s actually came out cooler than the 2000s — a fact that goes against ALL mainstream logic: we were told average temperatures would rise “linearly,” always up and up and up on an endless march to catastrophe if no poverty-inducing action was taken…

The Central England Temperature record (CET) measures the monthly mean surface air temperatures for the Midlands region of England. It is the longest series of monthly temperature observations in existence anywhere in the world, with data extending all the way back to the year 1659.

The CET’s mean reading for April, 2021 (to the 18th) is sitting at just 5.8C — that’s 1.5C below the 1961-1990 average (the current standard period of reference for climatological data used by the WMO–an historically cool era btw), and ranks as the coldest April since 1922, and the 18th coldest since records began 362 years ago.

GERMANY’S CHILLIEST SINCE 1917

With a mean temperature just of 4.5C, Germany is faring even worse than England — it is on for second coldest April since records began in 1881, and its coldest since 1917, according to German DWD national weather service records.

The following chart shows Germany’s mean temperature anomalies (through the 17th) — it’s been anomalously cold across the entire country:

..

Hansen’s 1988 global-warming prediction was thrice observation

by C. Monckton of Brenchley, Apr 21 , 2021, in WUWT


James Hansen is often debited with having stirred up so much alarm with his notorious 1988 prediction of runaway global warming in front of the U.S. Senate that IPeCaC was hastily founded later that year, so as to Save The Planet.

His prediction ran to 2020. How, then, did fantasy-land compare with more than two decades of sober, observed reality? The graph, zeroed so that the 1988 HadCRUT4 observed anomaly lies between Hansen’s three scenarios, shows that observed warming was closest to Hansen’s Scenario C.

However, the assumption underlying Scenario C is that everyone would be so scared following Hansen’s Senate testimony that what is now called “net-zero” would be achieved by 2000. Well, it wasn’t. And it won’t be, even by 2050. The chief reason is discernible in the Texas electricity grid collapse.

The Lone Star State, which ought to have had more common sense, decided that once it had carpeted the state with windmills (14th-century technology to fail to solve a 21st-century non-problem) and solar panels (produced by slave labor in China) it could reduce its dispatchable thermal grid capacity.

However, as any grid manager will tell you, you can’t do that. Not the least of the reasons why unreliables are so cripplingly expensive is that it is necessary to maintain the entire pre-existing grid regardless of how many unreliables are bolted on to it. Unreliables, therefore, inflict not only a deadweight cost but also a deadweight surplus capacity to the grid, to say nothing of the costly instability caused by giving unreliables precedence over thermal in meeting demand.

An anti–global warming hysteria book is driving Norwegian warming hysterics nuts

by G. Tomb, Apr 9, 2021 in AmercianThinker


Other than by misspelling “fjord,” how would an American geologist draw the ire of a pair of Norwegian politicians?  Answer: Write a book that counters the notion that human activity is causing the globe to warm with catastrophic consequences.

Gregory Wrightstone’s 2017 book, Inconvenient Facts: The Science that Al Gore Doesn’t Want You to Know, was published in Norway and is being promoted by the Climate Realists, a Norwegian organization, which shares the author’s view that modern warming is neither unusual nor unprecedented.

Backed with 90 illustrations and 15 pages of references, the book presents 60 footnoted facts inconvenient to the Western elite’s absurd narrative about global warming.  Among them: Most of the last 10,000 years have been warmer than today, including the Medieval Warm Period, when Vikings raised barley on Greenland, and the Roman Warm Period, when citrus grew in northern England.

Follow the Science: Seas Rising 20 Times Slower than the Media Claim

by J. Taylor, Apr 13, 2021 in ClimateRealism


According to NASA and NOAA satellite instruments, sea level is rising at a mere 3 millimeters per year, which is a pace of just under one foot per century. (Note, the NASA/NOAA-reported 3.3 mm/year rise in Global Mean Sea Level includes a 0.3 mm “adjustment” that accounts for land rising as glaciers melt. The sea-level rise in relation to coastal shorelines is therefore 3.0 mm/year.) Moreover, the satellite measurements show no significant acceleration during recent decades in the pace of sea-level rise.

Given that seas are rising at a pace of merely one foot per century, which is little if any faster than the pace of sea-level rise throughout the global warming of the 1800s and 1900s, it is almost certain that seas will not rise 20 feet during the next 100 to 200 years. It is also almost certain that seas will not rise two feet during the next 20 years.

Climate Catastrophe In The 17thC – Geoffrey Parker

by P. Homewood, Apr 9, 2021 in NotaLotofPeoppleKnowThat


Amazon’s blurb sets the scene:

Revolutions, droughts, famines, invasions, wars, regicides – the calamities of the mid-seventeenth century were not only unprecedented, they were agonisingly widespread.  A global crisis extended from England to Japan, and from the Russian Empire to sub-Saharan Africa. North and South America, too, suffered turbulence. The distinguished historian Geoffrey Parker examines first-hand accounts of men and women throughout the world describing what they saw and suffered during a sequence of political, economic and social crises that stretched from 1618 to the 1680s. Parker also deploys scientific evidence concerning climate conditions of the period, and his use of ‘natural’ as well as ‘human’ archives transforms our understanding of the World Crisis. Changes in the prevailing weather patterns during the 1640s and 1650s – longer and harsher winters, and cooler and wetter summers – disrupted growing seasons, causing dearth, malnutrition, and disease, along with more deaths and fewer births. Some contemporaries estimated that one-third of the world died, and much of the surviving historical evidence supports their pessimism.


Amongst these catastrophic events, Parker lists:


Early 17thC

1) West Africa, from the Sahel in the north to Angola in the south, suffered a prolonged drought between 1614 and 1619.

2) Catalonia suffered “the year of the flood” in 1617.

3) All Europe experienced an unusually cold winter in 1620/21, when many rivers froze so hard for 3 months that they could bear the weight of loaded carts; even the Bosphorus froze, an unheard of event.

4) Japan suffered its coldest spring of the century in 1616, while the sub tropical region of Fujian in China had heavy snowfall two years later, another extremely rare event.

5) Droughts in five years out of six between 1616 and 1621 almost the destroyed the new colonies in Virginia.

6) After a few better years, the summer of 1627 in Europe was the wettest for 500 years, followed by the “year without a summer” in 1628, when it was so cold that many crops never ripened.

7) Between 1629 and 1632, much of Europe suffered excessive rains, followed by drought.

8) Conversely, northern India suffered a “perfect drought” in 1630/31, followed the next year by catastrophic floods.

Parker notes that “all of these regions experienced dramatic falls in population

The Imaginary Climate Crisis: How can we Change the Message? A talk by Richard Lindzen

by Prof. Lindzen, Apr 7, 2021 in WUWT/Clintel


The Irish Climate Science Forum (ICSF) in cooperation with CLINTEL hosted a lecture by the world-renowned climate scientist Richard Lindzen. The online lecture was attended by around 200 people from around the world (including a group of climate activists who disturbed the talk. The recorded talk can be viewed here.


Professor Lindzen kindly agreed that his written speech could be posted here at CLINTEL. It follows below.


Richard S. Lindzen, Professor Emeritus of Atmospheric Sciences, MIT

For about 33 years, many of us have been battling against climate hysteria. We have correctly noted

The exaggerated sensitivity,
The role of other processes and natural internal variability,
The inconsistency with the paleoclimate record,
The absence of evidence for increased extremes, hurricanes, etc. and so on.

We have also pointed out the very real benefits of CO2 and even of modest warming. And, as concerns government policies, we have been pretty ineffective. Indeed our efforts have done little other than to show (incorrectly) that we take the threat scenario seriously. In this talk, I want to make a tentative analysis of our failure.

Subsidence In The Bangladesh Basin

by P. Homewood, Mach 26, 2021 in NotaLotofPeopleKnowThat


Absolute sea levels are rising by about 2mm a year, yet the land is subsiding by 2.2cm a year. A small part of this is due to isostasy, but most is evidently the result of “dewatering”, what we would call water extraction. (see here)

Whatever problems farmers in Bangladesh are having, it has nothing to do with climate change.

EUROPE’S POLAR COLD TO INTENSIFY THROUGH APRIL, AS NORTH AMERICA BRACES FOR A SIMILAR FATE — GRAND SOLAR MINIMUM

by Cap Allon, April 6, 2021 in Electroverse


Land masses across the northern hemisphere are experiencing a true taste of the GRAND SOLAR MINIMUM this spring, as while brief pockets of heat have intermittently prevailed, Arctic cold has never been far away, forever-threatening to wipe out those tender early-season crops that have been “tricked” into sprouting.

Overall, Earth’s temperature is falling (the UAH for March 2021 was 0.01C BELOW 30-year baseline), but brief pockets of heat will ALWAYS occur–even during the depths of an ice age. It is actually these swings between extremes that will hasten the failure of our modern, and surprisingly fragile, food production systems — constants are workable, even if those constants are cold, it is climatic unpredictability and extreme flip-flopping that is a growers most bitter foe.

EUROPE’S POLAR COLD TO INTENSIFY THROUGH APRIL

Recently, Europe has suffered a sharp reversal of fortunes — the continent has shifted gears, going from enjoying some of its warmest March temperatures on record, to a historic blast of polar cold and snow.

The low solar activity we’ve seen over the past few years has weakened the jet stream, reverting its usual strong zonal flow to more of a wavy meridional one. At the end of March, this flow was pulling warm African air anomalously far north, which resulted in the likes of Holland, Germany, France, and Belgium registering some of their warmest March temperatures ever recorded; and now, barely a week later, this loosey-goosey jet stream has conspired to drop brutal, record-breaking Arctic air over these exact same regions.


See also March Weather Past & Present

New Study: 100-Year Flood Events Have Decreased Globally Since 1970

by  K. Richard, Apr 6, 2021 in ClimateChangeDispatch


In contrast to alarming claims about rare, 100-year flood events now occurring every few years due to global warming, scientists have determined the exact opposite is more likely true.

Not only have flood frequencies declined globally in the last 50 years, but the probability of a 100-year flood event is now so rare it has only been occurring once every 358 years on average since 1970.

According to the IPCC, there has been no clear evidence of a global-scale increase in flood magnitude or frequency in the last century (Hodgkins et al., 2017).

A new study (Slater et al., 2021) suggests that claims of flood magnitude, frequency, and probability dramatically increasing with global warming can be “misleading” if they use a stationary calculation approach instead of continually updating significant changes over time.

These scientists, using “observed annual maximum daily streamflow” records and a “nonstationary approach,” concluded there has been no obvious global-scale trend in 20-, 50-, and 100-year flood magnitude since 1970, with 100-year flood events defined as “flows of a given exceedance probability in each year.

The Sun’s climate role confirmed

by D. Whitehouse, April 6, 2021 in GWPF


“The scientific community has been unclear on the role that solar variability plays in influencing weather and climate events here on Earth. This study shows there’s reason to believe it absolutely does and why the connection may have been missed in the past.”

Top: Six-month smoothed monthly sunspot number from SILSO.  Bottom: Oceanic El Niño Index from NOAA. Red and blue boxes mark the El Niño and La Niña periods in the repeating pattern. Source: Climate Etc, September 2019

If you ask most climate scientists, they will tell you that the Sun’s small variability is unimportant when it comes to influencing climate. They may have to change their minds if a new line of research holds up. It seems that solar variability can drive climate variability on Earth on decadal timescales (the decadal climatic variability that Michael Mann recently ‘proved’ doesn’t exist). That’s the conclusion of a new study showing a correlation between the end of solar cycles and a switch from El Nino to La Nina conditions in the Pacific Ocean. It’s a result that could significantly improve the predictability of the largest El Nino and La Nina events, which have several global climate effects.