by Cliffmass.blog, Nov 28, 2025
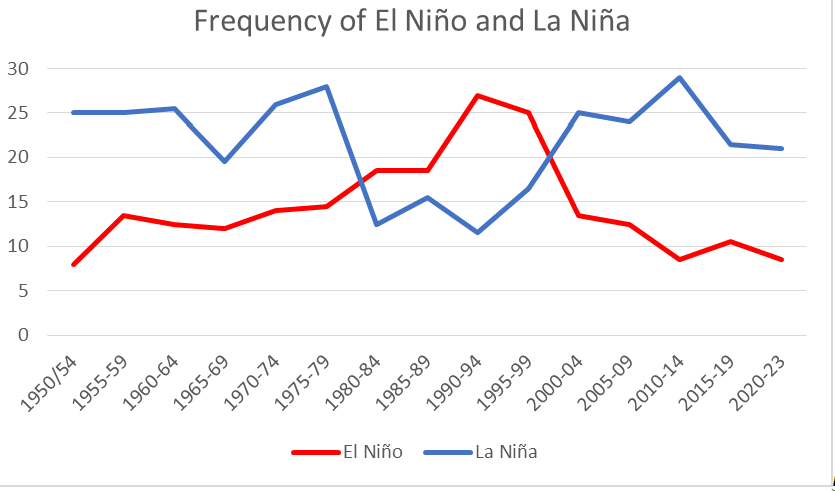
a Niña, associated with cool water over the tropical Pacific, has a significant impact on Northwest weather, influencing temperature, precipitation, and snowfall.
As described below, La Niña has strengthened recently, and some decidedly La Niña weather is now in the forecasts.
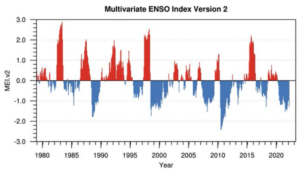
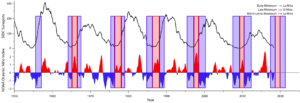
As noted in previous blogs, La Niña is associated with cooler-than-normal ocean temperatures over the central tropical Pacific, known as the Nino 3.4 area (see below)

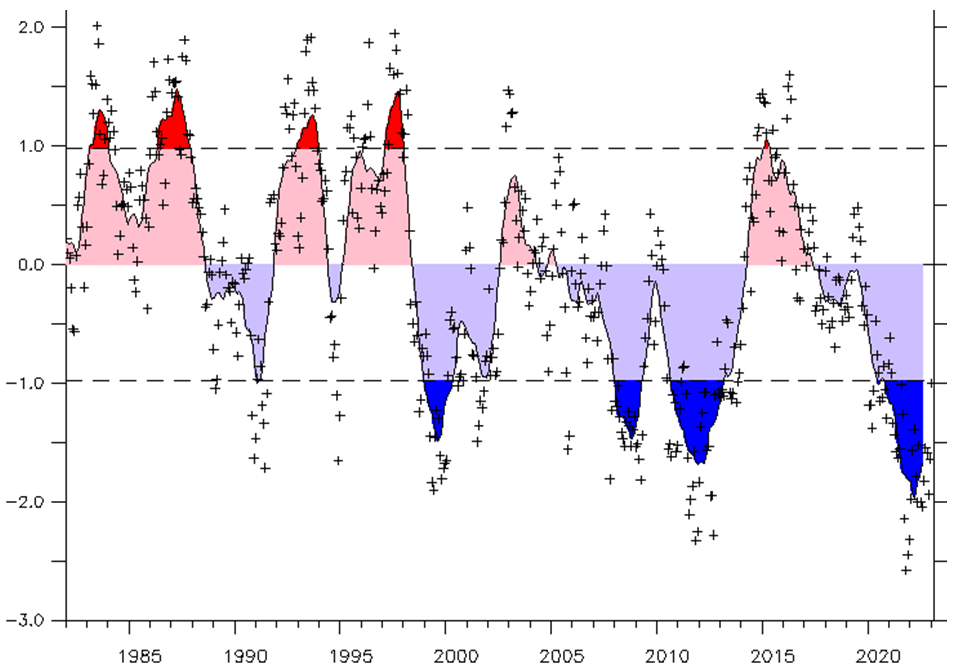
According to the latest observations, we are about to transition from a weak to a moderate La Niña (see figure below). This figure shows the difference from normal of the temperatures in the Nino 3.4 area, with blue colors indicating below-normal temperatures. A moderate La Nina is associated with a cool temperature anomaly larger than .9C.
We are now crossing this threshold to moderate La Niña conditions (see below).

…