by J.C. Maurin, 12 novembre 2018 in ScienceClimatEnergie
L’IPCC (GIEC en français) fut créé en 1988 par l’UNEP (United Nations Environment Programme) et le WMO (World Meteorological Organization). Dans les principes régissant les travaux du GIEC (1) on lit : Le GIEC a pour mission d’évaluer … les risques liés au changement climatique d’origine humaine.Le GIEC respecte son propre principe fondateur : il attribue l’intégralité de la hausse du taux de CO2 depuis 1958 à une cause anthropique. Nous examinerons ici le modèle anthropique du GIEC et nous le confronterons aux mesures contemporaines, puis à un modèle mixte. Cet article fait suite aux deux précédents publiés sur le site SCE au cours des mois de septembre (1/4) et octobre 2018 (2/4).
C. Modèle anthropique GIEC
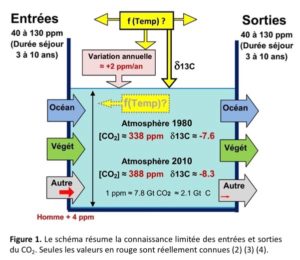
C.1 Les contraintes des modèles (Fig. 1)
Le paragraphe A (article 1/4) a montré qu’en 1980 le taux de CO2 atmosphérique était de 338 ppm et le δ13C de -7.6 ‰. En 2010 le taux de CO2 atmosphérique était de 388 ppm et leδ13C de -8.3 ‰. Il existe une modulation annuelle de ce taux, très marquée dans l’hémisphère Nord.
Des modèles, cela fait 40 ans que j’en fais », précise d’emblée Henri Masson. Ingénieur chimiste de formation (Université Libre de Bruxelles), docteur en sciences appliquées, professeur émérite à l’Université d’Anvers, expert globe-trotter (notamment pour la Banque Mondiale et l’ONU), l’homme est, de surcroît, doté d’un sérieux sens de la vulgarisation. Lorsque Contrepoints lui propose d’analyser les modèles prédictifs du GIEC, le Belge est catégorique : « Si mes étudiants me présentaient de tels modèles, je n’hésiterais pas à les recaler ! »
Contrepoints : Quelle confiance peut-on accorder aux modèles du GIEC, qui prévoient, parmi d’autres choses, un réchauffement planétaire dû aux émissions humaines de CO2 ?
by Bob Weber, November 12, 2018, updated, in HuffingtonPost
There are too many polar bears in parts of Nunavut and climate change hasn’t yet affected any of them, says a draft management plan from the territorial government that contradicts much of conventional scientific thinking.
The proposed plan — which is to go to public hearings in Iqaluit on Tuesday — says that growing bear numbers are increasingly jeopardizing public safety and it’s time Inuit knowledge drove management policy.
“Inuit believe there are now so many bears that public safety has become a major concern,” says the document, the result of four years of study and public consultation.
A male polar bear eats a piece of whale meat as it walks along the shore of Hudson Bay near Churchill, Man., on August 23, 2010. New research suggests an answer to the mystery of how polar bears survived previous eras of low sea ice. THE CANADIAN PRESS/Sean Kilpatrick
THE CANADIAN PRESS
A draft plan from the Nunavut government says growing bear numbers are increasingly jeopardizing public safety.
by J.C. Maurin, 12 novembre 2018 in ScienceClimatEnergie
L’IPCC (GIEC en français) fut créé en 1988 par l’UNEP (United Nations Environment Programme) et le WMO (World Meteorological Organization). Dans les principes régissant les travaux du GIEC (1) on lit : Le GIEC a pour mission d’évaluer … les risques liés au changement climatique d’origine humaine.Le GIEC respecte son propre principe fondateur : il attribue l’intégralité de la hausse du taux de CO2 depuis 1958 à une cause anthropique. Nous examinerons ici le modèle anthropique du GIEC et nous le confronterons aux mesures contemporaines, puis à un modèle mixte. Cet article fait suite aux deux précédents publiés sur le site SCE au cours des mois de septembre (1/4) et octobre 2018 (2/4).
…
C.4. Conclusions
Un modèle qui décrit un monde fixe, en équilibre, un modèle où l’homme est central, un modèle qui parvient à reproduire certaines observations mais pas toutes, un modèle unanimement soutenu par les autorités politiques ou morales, enfin un modèle qui pose a priori un principe intangible… est le type même de modèle qui fut développé par Ptolémée (6) pour le système solaire. Ce modèle fut jadis l’objet d’un consensus à > 97%.
L’atmosphère actuelle comporte environ 20 ppm de CO2 anthropique correspondant à 20/400 soit ≈ 5% du CO2 atmosphérique. En un siècle les hommes ont donc modifié la composition de l’atmosphère de 20 ppm soit 0,002% : sur ce sujet également, il semble que nous ne soyons pas au centre du monde.
Les évolutions récentes du CO2 atmosphérique ne peuvent pas avoir une cause uniquement anthropique: les observations du δ13C l’interdisent. Les causes sont anthropiques et naturelles. Le modèle purement anthropique du GIEC est donc à rejeter.
Regional differences regarding other reconstructions
The results of the study show a temperature rise in the beginning of the Holocene, reaching the highest values in the Holocene Climate Optimum (about 7,800 years ago). There are also high temperatures until about 6,000 years ago, when a decline of temperature started and led to the lowest values in the first stage of the late Holocene (about 4,200 and 2,000 years ago).
Last, researchers detected a rise of temperatures over the two last millenniums, but they state they have to be careful with these data. “We cannot guarantee the observed rise in the reconstruction results from a temperature rise only, we cannot rule out other variables that can influence at other levels, such as the gradual increase of the anthropic activity in the area, which can change the community of Chironomidae to species that adapt to higher temperatures, but there are also human influence indicators,” says Narcís Prat.
Although these conclusions can coincide with other paleoclimate reconstructions, results also highlight some divergences at a regional level. “These differences can occur due the fact that some indicators point out to different seasonal signs. Therefore, Chironomidae are indicators of temperature in summer, while others such as chrysophites or alkenones are related to winter/spring temperatures,” notes the researcher.
A new study, based on 27 years of data from Mana Pools National Park in Zimbabwe, suggests that temperature increases over the last three decades have already caused major declines in local populations of tsetse flies.
This analysis, published in the journal PLOS Medicine this week, provides a first step in linking temperature to the risk of sleeping sickness in Africa.
…
My analysis
A model for fly population mortality is only as good as the temperature data used to run the model. It appears they only used one source of temperature data, the only one available to them, the Rekomitjie Research Station.
Interestingly, this helpful photo was also included in the press release from Eurekalert. It is the weather station used to monitor climate at the Rekomitjie Research Station, Zimbabwe. I provide it below, click for full-size. At the scale displayed above, you might not notice some important details about the weather station itself, but I did. Here it is, magnified: …
by P. Homewood, November 8, 2018 in NotaLotofPeopleKnowThat
…
My very first foray into climate blogging was an analysis of extreme weather events in 1971. (I wrote it in 2011, so it was not a cherrypicked year, merely a nice round 40 years before.)
I won’t bore you with it again, as it was basically just a very long list. You can see it here though.
But here is a summary, which goes to show that extreme weather is the norm, not the exception:
The authors evaluate the United Nations Intergovernmental Panel on Climate Change (IPCC) consensus that the increase of carbon dioxide in the Earth’s atmosphere is of anthropogenic origin and is causing dangerous global warming, climate change and climate disruption. The totality of the data available on which that theory is based is evaluated. The data include: (a) Vostok ice-core measurements; (b) accumulation of CO2 in the atmosphere; (c) studies of temperature changes that precede CO2 changes; (d) global temperature trends; (e) current ratio of carbon isotopes in the atmosphere; (f) satellite data for the geographic distribution of atmospheric CO2; (g) effect of solar activity on cosmic rays and cloud cover. Nothing in the data supports the supposition that atmospheric CO2 is a driver of weather or climate, or that human emissions control atmos- pheric CO2.
Climate variability is a well-known phenomenon and has been frequently, though complex, linked to solar forcing on different time scales. The importance of solar forcing related climate variability is crucial in our understanding of paleoclimate and future climate changes, as well as building climate models. Here in, we present the late Holocene (last ca 1400) climate records from Lake Salda in SW Anatolia using high-resolution micro X-ray Fluorescence (μ-XRF), magnetic susceptibility (MS), stable isotopes (δ13C and δ18O) and TOC-TIC measurements. The age model is constructed by using radionuclide (210Pb, 137Cs and 14C) dating methods. The lake’s high-resolution multiproxy results revealed lake water level fluctuations associated with humid and dry spells during the last 1400 years. Periods of higher lake levels are consistent with solar maxima in total solar irradiance and vice versa. Moreover, the Lake Salda records clearly show dry Dark Ages Cold Period (DACP), humid Medieval Climatic Anomaly (MCA), dry Little Ice Age (LIA), and humid Modern Warm Period (MoWP). These records suggest that the solar forcing, through its influence on the atmospheric circulation, is the main mechanism of climate change during the DACP, MCA, LIA and MoWP in this region.
by Paul Dorian, November 5, 2018 in PerspectaWeather
Overview
The sun is blank again today and has been without sunspots about 60% of the time this year as the current historically weak solar cycle heads towards the next solar minimum. Solar cycle 24 is currently on pace to be the weakest sunspot cycle with the fewest sunspots since cycle 14 peaked in February 1906. Solar cycle 24 continues a recent trend of weakening solar cycles which began with solar cycle 21 that peaked around 1980. The last time the sun was this blank in a given year on a percentage basis was 2009 during the last solar minimum when 71% of the time was spotless. That last solar minimum actually reached a nadir in 2008 when an astounding 73% of the year featured a spotless sun – the most spotless days in a given year since 1913. All indications are that the fast-approaching next solar minimum may be even quieter than the last one which was the deepest in nearly a century.
One of the natural consequences of a solar minimum is for the upper part of the Earth’s atmosphere to cool down. Another natural impact of decreasing solar activity is the weakening of the ambient solar wind and its magnetic field which, in turn, allows more cosmic rays to penetrate the solar system. The intensification of cosmic rays can have important consequences on such things as the safety of airline passengers and astronauts in space, Earth’s cloud cover and climate, and possibly even on lightning.
…
Daily observations of the number of sunspots since 1 January 1977 according to Solar Influences Data Analysis Center (SIDC). The thin blue line indicates the daily sunspot number, while the dark blue line indicates the running annual average. The recent low sunspot activity is clearly reflected in the recent low values for the total solar irradiance. Compare also with the geomagnetic Ap-index. Data source: WDC-SILSO, Royal Observatory of Belgium, Brussels. Last day shown: 31 October 2018. Last diagram update: 1 November 2018.
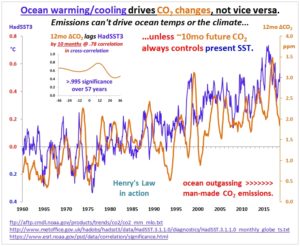
► Changes in global atmospheric CO2 are lagging 11–12 months behind changes in global sea surface temperature. ► Changes in global atmospheric CO2 are lagging 9.5–10 months behind changes in global air surface temperature. ► Changes in global atmospheric CO2 are lagging about 9 months behind changes in global lower troposphere temperature. ► Changes in ocean temperatures explain a substantial part of the observed changes in atmospheric CO2 since January 1980. ► Changes in atmospheric CO2 are not tracking changes in human emissions.
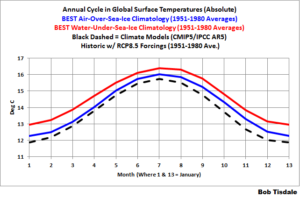
Alternate Title: The Annual Cycle in Global Land+Ocean Surface Temperature IS Far Greater Than 1.5 Deg C, AND Much-Much-MUCH Greater Than 1.5 Deg C Annually for Global Land Air Surface Temperatures
We all were taught early in school that the Earth orbits the Sun…that its path is elliptical…that because of the tilt in Earth’s axis of rotation, we have seasons as the Earth orbits our star annually. Because of the elliptical orbit, and because the ratios of land to ocean are different between the Northern and Southern Hemispheres, we might expect that global average surface temperatures would vary over the course of a year.
Later in life we’ve been brow beaten with alarmism about human-induced global warming and climate change…that the Earth will become a literal—not figurative—hell if global surface temperatures rise—formerly 2-deg C—now 1.5 deg C above pre-industrial levels. But does the average person know much global surface temperatures vary annually as it orbits the Sun? It’s unlikely, because I’ve never before seen graphs that are similar to what’s presented in this post or seen it discussed in any of the global warming literature. Am I expecting most persons to find this information to be of any interest? Nope. I simply find it noteworthy that, as I mentioned before, I’ve never seen it presented anywhere. In fact, I just Googled, in quotes, “How Much Do Global Surface Temperatures Cycle Annually?” and Google replied (their boldface), “No results found for “How Much Do Global Surface Temperatures Cycle Annually?”.
Remarkable, is it not, in these times of global warming interest?
Enough with the preamble and on to the meat of the post:
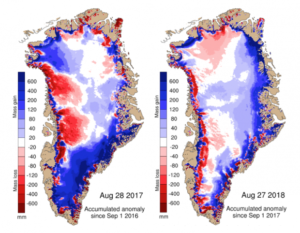
The end of August traditionally marks the end of the melt season for the Greenland ice sheet as it shifts from mostly melting to mostly gaining snow.
As usual, this is the time when the scientists at DMI and our partners in the Polar Portal assess the state of the ice sheet after a year of snowfall and ice melt. Using daily output from a weather forecasting model combined with a model that calculates melt of snow and ice, we calculate the “surface mass budget” (SMB) of the ice sheet.
This budget takes into account the balance between snow that is added to the ice sheet and melting snow and glacier ice that runs off into the ocean. The ice sheet also loses ice by the breaking off, or “calving”, of icebergs from its edge, but that is not included in this type of budget. As a result, the SMB will always be positive – that is, the ice sheet gains more snow than the ice it loses.
For this year, we calculated a total SMB of 517bn tonnes, which is almost 150bn tonnes above the average for 1981-2010, ranking just behind the 2016-17 season as sixth highest on record.
By contrast, the lowest SMB in the record was 2011-2012 with just 38bn tonnes, which shows how variable SMB can be from one year to another.
…
Maps show the difference between the annual SMB in 2017 (left) and 2018 (right) compared with the 1981-2010 period (in mm of ice melt). Blue shows more ice gain than average and red shows more ice loss than average. (Credit: DMI Polar Portal)
The Intergovernmental Panel on Climate Change Assessment Report 5 (IPCC AR5, 2013) discussed bulk atmospheric temperatures as indicators of climate variability and change. We examine four satellite datasets producing bulk tropospheric temperatures, based on microwave sounding units (MSUs), all updated since IPCC AR5. All datasets produce high correlations of anomalies versus independent observations from radiosondes (balloons), but differ somewhat in the metric of most interest, the linear trend beginning in 1979. The trend is an indicator of the response of the climate system to rising greenhouse gas concentrations and other forcings, and so is critical to understanding the climate. The satellite results indicate a range of near-global (+0.07 to +0.13°C decade−1) and tropical (+0.08 to +0.17°C decade−1) trends (1979–2016), and suggestions are presented to account for these differences. We show evidence that MSUs on National Oceanic and Atmospheric Administration’s satellites (NOAA-12 and −14, 1990–2001+) contain spurious warming, especially noticeable in three of the four satellite datasets.
Comparisons with radiosonde datasets independently adjusted for inhomogeneities and Reanalyses suggest the actual tropical (20°S-20°N) trend is +0.10 ± 0.03°C decade−1. This tropical result is over a factor of two less than the trend projected from the average of the IPCC climate model simulations for this same period (+0.27°C decade−1).
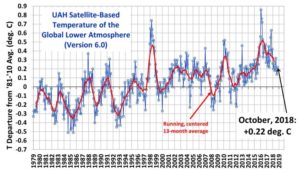
The Version 6.0 global average lower tropospheric temperature (LT) anomaly for October, 2018 was +0.22 deg. C, up a little from +0.14 deg. C in September. The linear temperature trend of the global average lower tropospheric temperature anomalies from January 1979 through October 2018 remains at +0.13 C/decade.
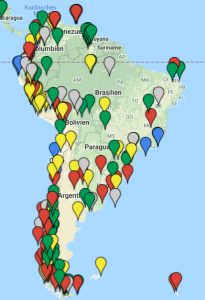
Pas un seul État membre de l’UE ne figure parmi les 16 pays sur 197 qui, selon une étude réalisée par un centre de recherche américain et deux centres de recherche britanniques, ont pris les mesures politiques appropriées promises dans le cadre de l’accord de Paris sur le climat.
La Norvège, le Monténégro et la Macédoine sont les seuls pays européens à avoir pris les mesures politiques appropriées pour réduire les émissions de gaz à effet de serre correspondant aux promesses faites lors de la signature de l’accord de Paris sur le climat.
À Paris, plus de 197 pays se sont portés volontaires pour réduire leurs émissions de gaz à effet de serre lors de la conférence COP21 en décembre 2015.
In April last year, the EPA replaced its online climate change section with a holding page that said the content was being updated to “reflect the agency’s new direction under President Donald Trump”.
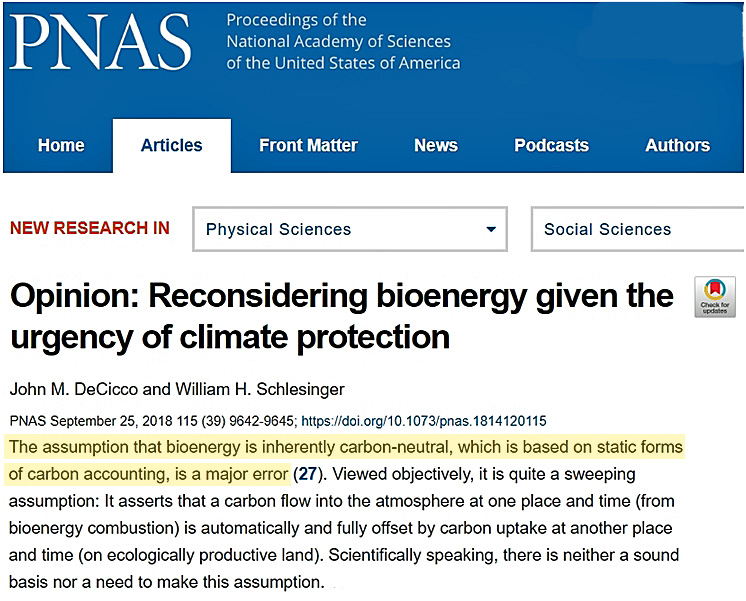
by K. Richard, November 1, 2018 in NoTricksZone/PNAS
Governments vociferously promote bioenergy as renewable, sustainable, and carbon-neutral. But scientists are increasingly characterizing this “belief” as a “major error”, as bioenergy generates more CO2 emissions per kWh than burning coal does, and the projected rapid growth in bioenergy will serve to ‘increase atmospheric CO2 for at least a century’ as well as clear forests and destroy natural ecosystems.
Global warming alarmist scientists like claiming that the well documented Medieval Warm Period (MWP) was merely a regional phenomenon, and not global. However a new publication by Lüning et al adds yet another study that shows the warm period from 1000 years ago was indeed global.
When analyzing complex systems with multiple interacting variables it is useful to note the advice of Enrico Fermi who reportedly said “never make something more accurate than absolutely necessary”.
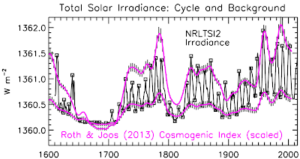
My recent paper presented a simple heuristic approach to climate science which plausibly proposed that a Millennial Turning Point (MTP) and peak in solar activity was reached in 1991.
Zharkova et al 2015 DOI:10.10381/srep15683 says ” Dynamo waves are found generated with close frequencies whose interaction leads to beating effects responsible for the grand cycles (350-400 years) superimposed on a standard 22 year cycle. This approach opens a new era in investigation and confident prediction of solar activity on a millenium timescale. ”
Svalgaard concluded in his essay on WUWT 10/27 2018:
The temperature increase since about 1650 is clearly chiefly due to the up- leg in the natural solar activity millennial cycle as shown by Lean 2018 “Estimating Solar Irradiance Since 850 AD” Fig 5
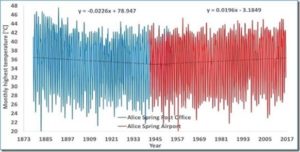
A recent paper Trajectories of the Earth System in the Anthropocene (Ref. [1] below) claims that even if the CO2 emission reductions called for in the Paris Agreement are met, our Earth may still enter what they call “Hothouse Earth” conditions, a long-term stabilization at temperature 4-5 °C-higher than pre-industrial temperatures, and sea-level 10-60 m-higher than today. They conclude calling for an accelerated transition towards a CO2 emission-free-world-economy. There is, however, very little evidence that the apocalyptic prediction is scientific grounded. Where really measured, the temperatures haven’t increased dramatically, and similarly, the sea-levels haven’t risen dramatically. More importantly, any acceleration of the temperature warming, or any acceleration of the rate of rise of the sea-level, are hard to detect.
Figure 1 –sample long-term-trend thermometer results (Alice Spring, NT, Australia). The temperatures were recorded in the Post Office / City and Airport locations. Data downloaded from www.bom.gov.au/climate/data/.
Friends of Science Society is critical of the IPCC SR15 report, pointing out the following:
We are in the Meghalayan, not the Anthropocene. The IPCC SR15 report claims to view climate change through “the lens of the Anthropocene.” This term is popularly used to describe a modern geological period wherein humans are assumed to have a larger impact on the world than nature. On July 13, 2018, the International Union of Geological Sciences (IUGS) issued a statement that the earth is now in the Meghalayan, a period that began 4,200 years ago. In response to questions as to why the term “Anthropocene” had not been included, at least for the past 50 years of presumed human influence, the IUGS responded that the term “Anthropocene” has not even been submitted for consideration and that the term has only sociological, not scientific relevance. The IPCC should not use this ‘lens.’
All climate models (simulations) used by the IPCC run ‘too hot’ versus observations. The computer simulations project future warming (thus being the rationale for global warming climate policies) show significantly higher temperatures than what is being observed. Only the Russian climate model and satellite/weather balloon data closely match present temperatures in the lower troposphere. This suggests that most climate models ascribe too great an effect of warming (climate sensitivity) to carbon dioxide.
This means the climate models should not be used to set public policy.
No temperature can be accurately measured to a precision of less than ±0.1°C. global temperature data is a metric of averaged and adjusted data from many sources, suggesting that a 0.5°C difference in temperature is moot and an arbitrary figure. It does not reference an actual measurement of earth’s temperature; people are being misled.
While Brazil has elected a climate sceptical president, Germany’s ‘climate chancellor’ Angela Merkel has announced that she is gradually stepping down from her political roles. Green news outlets are voicing concern that these and other developments in the Western world are putting the Paris agreement and the entire climate agenda at risk of falling apart.
This post is a coarse screening assessment of HadCRUT4 global temperature anomalies to determine the impact, if any, of data quality and data coverage. There has been much discussion on WUWT about the quality of the Hadley temperature anomaly dataset since McLean’s Audit of the HadCRUT4Global Temperature publication which is paywalled. I purchased a copy to see what all the hub-bub was about, and it is well worth the $8 in my view. Anthony Watts’ review of McLean’s findings and executive summary can be found here.
A key chart for critical study is McLean’s Figure 4.11 in his report. McLean suggests that HadCRUT4 data prior to 1950 is unreliable due to inadequate global coverage and high month-to-month temperature variability. For this post, I subdivided McLean’s findings into three groups shown with added shading: Good data which covers the years post-1950. During this period global data coverage is excellent at greater than 75% and month-to-month temperature variation is low. Questionable data occurs from 1880 to 1950. During this period global data coverage ranged from 40% to 70% with higher monthly temperature variations. Poor data is pre-1880 when global coverage ranged from 14 to 25% with extreme monthly temperature variations.
La géologie, une science plus que passionnante … et diverse