And What Have the Average Temperatures of Earth’s Surfaces Been Recently in Absolute Terms, Not Anomalies?
The answers may surprise you.
THIS POST HAS BEEN UPDATED. The update is near the end of the post.
…
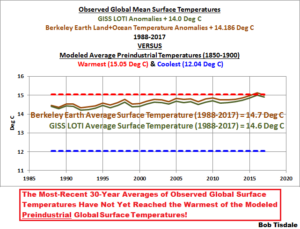
So, for the purpose of this very simple illustration and comparison, and for the discussions it will generate, I’ve added 14 deg C to the annual GISS LOTI data available here, and added 14.186 deg C to the annual Berkeley Earth data. I also compared them to the 12.04 deg C to 15.05 deg C range of hindcast preindustrial global mean surface temperatures from the climate model ensemble members discussed earlier. See Figure 3. Not too surprisingly, the Berkeley Earth and GISS global mean surface temperatures, in absolute form, are very similar, with only a 0.1 deg C difference during the most recent 30-years.
Winter has arrived much earlier than normal this year, particularly across North America, where cold records have been shattered.
This Thanksgiving is in fact going down as one of the coldest ever on record across the Northeast. The Washington Post here, for example, reports that Thanksgiving and Black Friday 2018 will be remembered for a record-shattering cold snap across the Northeast United States.”
…
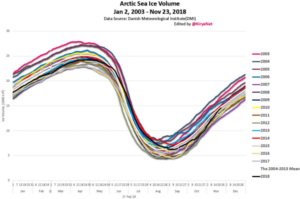
Arctic sea ice, snow and ice cover rebound
Arctic sea ice volume has rebounded and is near normal levels. The sea ice trend has remained stable over the past decade and thus defy all the climate alarmist predictions of an Arctic meltdown.
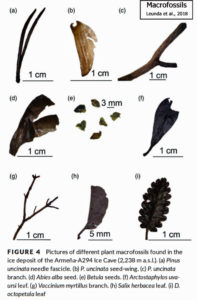
Newly published macrofossil discoveries from 4 papers strongly suggest that modern warmth may still be about 3°C colder than nearly all of the last 10,000 years.
La raison d’être de la taxe carbone qui pèse sur les carburants est qu’en augmentant le prix des carburants en France, cette taxe va diminuer la consommation de carburant, et les rejets de CO2 qui vont avec. Le raisonnement est solide. Mais la question est : de combien ? C’est l’enjeu. L’augmentation de cette taxe met le pays à feu et à sang. C’est la chandelle. Le jeu en vaut-il bien la chandelle ?
Pour y répondre il faut connaître la sensibilité de la consommation au prix, ce qu’on appelle l’élasticité-prix. C’est le rapport de l’effet, la variation de consommation (mesurée en %) sur la cause, la hausse de prix (également mesurée en %). Si une hausse des prix de 10% entraîne une diminution de consommation de 8%, l’élasticité est de -0,8.
Chapter 6 – Temperature Changes in the United States of the U.S. Global Change Research Program’s recently published Climate Science Special Report (2017) clearly shows and discusses, under the heading of “6.1.2 Temperature Extremes”, how temperature extremes for the contiguous United States have become more moderate over the last 118 years, with the coldest daily temperatures warming and the warmest daily temperatures cooling. In other words, temperature-extreme-related climate in the United States has improved.
by Paul Berth, 22 novembre 2018, in ScienceClimatEnergie
Les microbulles de gaz emprisonnées dans les carottes de glace sont fréquemment utilisées pour estimer le taux de CO2 de l’atmosphère du passé. Il s’agit de méthodes de mesure indirectes. Par exemple la carotte de glace EPICA Dome C en Antarctique nous suggère que le CO2 de l’atmosphère a varié entre 180 et 300 ppmv pendant les derniers 650 000 ans (Brook 2005). Cependant, le taux de CO2 observé dans ces carottes de glace représente-il vraiment l’atmosphère du passé? Nous allons montrer ici qu’un paramètre est souvent négligé par les glaciologues, et que ce paramètre pourrait avoir un effet considérable sur le résultat des analyses : il s’agit de la présence de micro-organismes dans la glace et les microbulles.
The evidence that “global” warming has not been global in scale continues to accumulate. Two more new reconstructions from the Western Pacific (He et al., 2018) and subpolar North Atlantic (Orme et al., 2018) indicate that modern temperatures have continued to decline since the onset of the Little Ice Age.
These add to the nearly 300 graphs published in the scientific literature since 2017 showing that there is nothing unusual, unprecedented, or remarkable about the temperatures changes in the last 150 years.
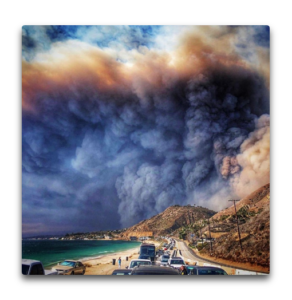
The Camp Fire that struck the northern California town of Paradise and vicinity is a profoundly disturbing environmental disaster of first magnitude. Nearly 100 people have lost their lives, approximately 10,000 homes have been lost, a major community has essentially been destroyed, and millions of people have been exposed to high concentrations of smoke. Tens of thousands of people have been displaced and lives of millions substantially affected.
And beyond the heart-wrenching losses noted above, it is doubly tragic that this disaster was both foreseeable and avoidable, resulting from a series of errors, poor judgment, lack of use of available technology, and poor urban planning.
It is more than unfortunate that some politicians, environmental advocacy groups, and activist scientists are attempting to use this tragedy as a tool for their own agenda, make the claim that the Camp Fire was result of global warming.
In the climate alarmists’ worldwide crusade against carbon dioxide gas, only the most delusional still believe that wind and solar power add anything to their arsenal.
As we have said repeatedly, nuclear power is the only stand-alone power generation source which is capable of delivering power on demand, without CO2 emissions being generated in the process.
Perversely, notwithstanding that Australia is in the top three uranium exporters, it’s the only G20 country with a legislated prohibition on nuclear power generation…
Reflections on Nic Lewis’ audit of the Resplandy et al. paper.
In response to Nic Lewis’ two blog posts critiquing the Resplandy et al. paper on ocean temperatures, co-author Ralph Keeling acknowledges the paper’s errors with these statements:
…
Conclusions
By quickly admitting mistakes and giving credit where due, Ralph Keeling has done something unusual and laudatory in the field of climate science. If all climate scientists behaved this way, there would be no ‘hostile environment.’
I find it to be a sad state of affairs when a scientist admitting mistakes gets more kudos than the scientist actually finding the mistakes. But given the state of climate science, I guess finding mistakes seems to be a more common story than a publishing scientist actually admitting to mistakes.
Given the importance of auditing climate research and independent climate scientists working outside of institutional frameworks, I wish there was some way to encourage more of this. In the absence of recognition and funding, I don’t have much to suggest
Not all polar bears are in the same dire situation due to retreating sea ice, at least not right now. Off the western coast of Alaska, the Chukchi Sea is rich in marine life, but the number of polar bears in the area had never been counted. The first formal study of this population suggests that it’s been healthy and relatively abundant in recent years, numbering about 3,000 animals.
The study by researchers at the University of Washington and federal agencies is published Nov. 14 in Scientific Reports, an open-access journal from the Nature Publishing Group.
“This work represents a decade of research that gives us a first estimate of the abundance and status of the Chukchi Sea subpopulation,” said first author Eric Regehr, a researcher with the UW’s Polar Science Center who started the project as a biologist in Alaska with the U.S. Fish and Wildlife Service. “Despite having about one month less time on preferred sea ice habitats to hunt compared with 25 years ago, we found that the Chukchi Sea subpopulation was doing well from 2008 to 2016.
Over 8,000 homes and businesses have been reduced to ashes and rubble by the latest California conflagrations. Well over 60 people have perished, over 50,000 are homeless, hundreds remain missing. “This is the new abnormal,” Governor Jerry Brown insists. “Dryness, warmth, drought, all those things are going to intensify,” because of climate change. Even if we do more on forest management, that won’t stop climate change. “And those who deny that are definitely contributing to the tragedies.”
Those assertions have no basis in fact. The hard, incontrovertible reality is that California has always been a largely arid state, afflicted by prolonged droughts, interspersed with periods of intense rainfall, and buffeted almost every autumn by strong winds that can whip forest fires into infernos. The problem isn’t climate change. It’s ideological, even criminally incompetent forest management practices demanded by politicians, regulators, judges and environmentalists in recent decades. My article presents the real story.
Let me start explaining the link from Picasso to climate science by looking at what Dr. Nir Shaviv called “the most boring graph I have ever plotted in my life”.
This is the graph of the changes in the best estimate of the range of what is called “climate sensitivity” over the last forty years or so.
What is climate sensitivity when it’s at home? To explain that, I’ll have to take a slight detour. First, downwelling radiation.
“Downwelling” in climate science means headed down towards the planetary surface. Downwelling radiation is the total radiation going downwards towards the surface. It is composed of sunshine (shortwave) plus thermal radiation from the atmosphere (longwave). In climate science, this quantity, total downwelling radiation, is called “forcing”, abbreviated “F”
The central paradigm of modern climate science is that if you change the amount of downwelling radiation (forcing), that the surface temperature perforce will change. The claim is that everything else averages out, and if the forcing increases, then surface temperature needs to change to maintain the global energy balance. It has to change. It must.
In short, the central paradigm of modern climate science is the following:
In the long run, global temperature change is proportional to global forcing change.
The putatively constant proportion between the two, which is the temperature change divided by forcing change, is called the “climate sensitivity”.
A new study by The University of Texas at Austin has demonstrated a possible link between life on Earth and the movement of continents. The findings show that sediment, which is often composed of pieces of dead organisms, could play a key role in determining the speed of continental drift. In addition to challenging existing ideas about how plates interact, the findings are important because they describe potential feedback mechanisms between tectonic movement, climate and life on Earth.
The study, published Nov. 15 in Earth and Planetary Science Letters, describes how sediment moving under or subducting beneath tectonic plates could regulate the movement of the plates and may even play a role in the rapid rise of mountain ranges and growth of continental crust
Ask medieval historian Michael McCormick what year was the worst to be alive, and he’s got an answer: “536.” Not 1349, when the Black Death wiped out half of Europe. Not 1918, when the flu killed 50 million to 100 million people, mostly young adults. But 536. In Europe, “It was the beginning of one of the worst periods to be alive, if not the worst year,” says McCormick, a historian and archaeologist who chairs the Harvard University Initiative for the Science of the Human Past.
A mysterious fog plunged Europe, the Middle East, and parts of Asia into darkness, day and night—for 18 months. “For the sun gave forth its light without brightness, like the moon, during the whole year,” wrote Byzantine historian Procopius. Temperatures in the summer of 536 fell 1.5°C to 2.5°C, initiating the coldest decade in the past 2300 years. Snow fell that summer in China; crops failed; people starved. The Irish chronicles record “a failure of bread from the years 536–539.” Then, in 541, bubonic plague struck the Roman port of Pelusium, in Egypt. What came to be called the Plague of Justinian spread rapidly, wiping out one-third to one-half of the population of the eastern Roman Empire and hastening its collapse, McCormick says.
by P. Homewood, November 17, 2018 in NotalotofPeopleKnowThat
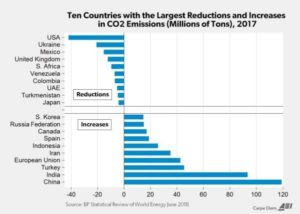
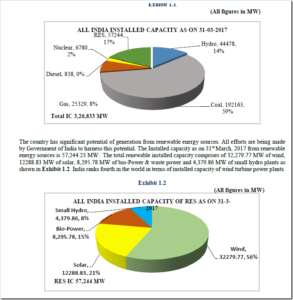
It’s worth taking a closer look at the claim made last week that India is leading the world in tackling climate change.
The claim was based on India’s latest National Electricity Plan (NEP), which was published in April 2018. Below is the current situation for installed capacity, according to the NEP:
D’abord cette info surprenante. Une étude récente sur le réchauffement des océans a dû être modifiée après publication dans Nature. L’étude, très alarmiste, avait pourtant été révisée puis validée par un comité de lecture et publiée dans la plus prestigieuse revue scientifique au monde. Or la méthodologie et les conclusions de cette recherche étaient erronées.
…
La faille a été découverte par Nic Lewis, un chercheur climato-critique très populaire en Grande-Bretagne. Il affirme, et les faits lui donnent raison: « Je suis légèrement surpris que ni les pairs examinateurs ni le rédacteur en chef n’aient repéré ce qui me semblait être une alarme rouge à la page 1. »
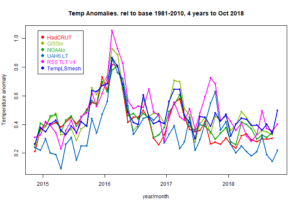
As you’ll soon see, there was an eye-catching uptick (+0.25 deg C) in the GISS global Land-Ocean Temperature Index (LOTI) data from September to October 2018. We’ll have to wait for next month’s update to see if it also appears in the NOAA and Met Office datasets.
…
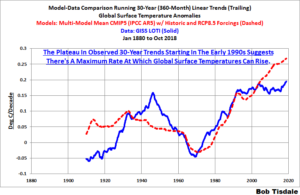
Figure 8
There are numerous things to note in the trend comparison. First, there is a growing divergence between models and data starting in the early 2000s. The continued rise in the model trends indicates global surface warming is supposed to be accelerating, but the data indicate little to no acceleration since then. Second, the plateau in the data warming rates begins in the early 1990s, indicating that there has been very little acceleration of global warming for more than 2 decades. This suggests that there MAY BE a maximum rate at which surface temperatures can warm. Third, note that the observed 30-year trend ending in the mid-1940s is comparable to the recent 30-year trends. (That, of course, is a function of the new NOAA ERSST.v5 data used by GISS.) Fourth, yet that high 30-year warming ending about 1945 occurred without being caused by the forcings that drive the climate models. That is, the climate models indicate that global surface temperatures should have warmed at about a third that fast if global surface temperatures were dictated by the forcings used to drive the models. In other words, if the models can’t explain the observed 30-year warming ending around 1945, then the warming must have occurred naturally. And that, in turns, generates the question: how much of the current warming occurred naturally? Fifth, the agreement between model and data trends for the 30-year periods ending in the 1960s to about 2000 suggests the models were tuned to that period or at least part of it. Sixth, going back further in time, the models can’t explain the cooling seen during the 30-year periods before the 1920s, which is why they fail to properly simulate the warming in the early 20thCentury.
One last note, the monumental difference in modeled and observed warming rates at about 1945 confirms my earlier statement that the models can’t simulate the warming that occurred during the early warming period of the 20th Century.
The year 2018 could mark the beginning of the end of climate change alarmist reporting. Projections of catastrophic melting of the ice sheets and sea level rise swallowing up the Earth’s coasts are increasingly undermined by observation.
…
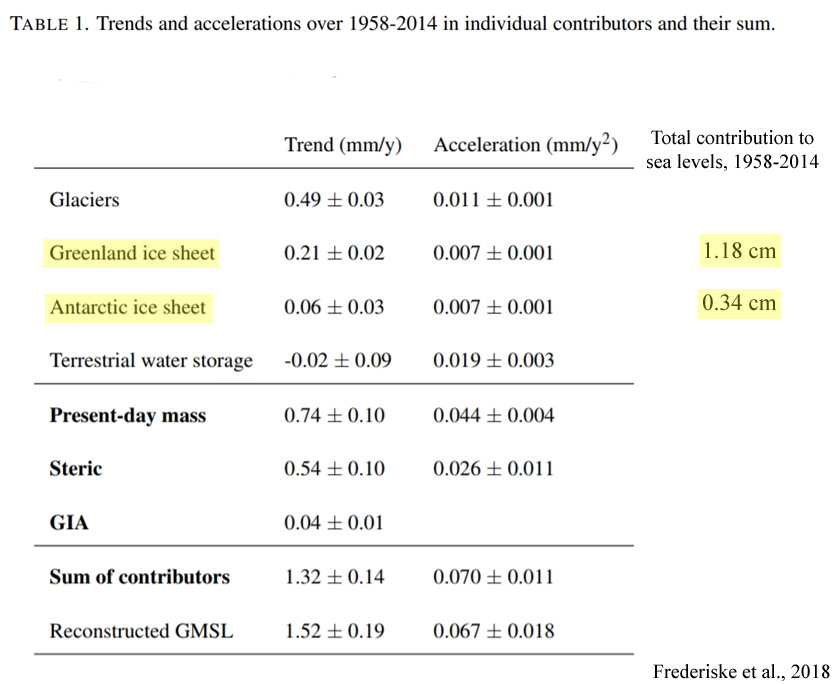
Despite the hackneyed practice of reporting “staggering” ice sheet melt for both Greenland and Antarctica in recent decades, the two polar ice sheets combined to add just 1.5 centimeters to sea level rise between 1958 and 2014 (graphfrom Frederikse et al., 2018) as global sea levels only rose by “1.5 ± 0.2 mm yr−1 over 1958–2014 (1σ)” or “1.3 ± 0.1 mm yr−1 for the sum of contributors”.
That’s about 7.8 centimeters (3.1 inches) of global sea level change in 56 years.
by M. Bastasch, November 14, 2018 in WUWT/DailyCaller
Scientists behind a headline-grabbing climate study admitted they “really muffed” their paper.
Their study claimed to find 60 percent more warming in the oceans, but that was based on math errors.
The errors were initially spotted by scientist Nic Lewis, who called them “serious (but surely inadvertent) errors.”
The scientists behind a headline-grabbing global warming study did something that seems all too rare these days — they admitted to making mistakes and thanked the researcher, a global warming skeptic, who pointed them out.
“When we were confronted with his insight it became immediately clear there was an issue there,” study co-author Ralph Keeling told The San Diego Union-Tribune on Tuesday.
Their study, published in October, used a new method of measuring ocean heat uptake and found the oceans had absorbed 60 more heat than previously thought. Many news outlets relayed the findings, but independent scientist Nic Lewis quickly found problems with the study.
There is much criticism here of the estimates of global surface temperature anomaly provided by the majors – GISS, NOAA and HADCRUT. I try to answer these specifically, but also point out that the source data is readily available, and it is not too difficult to do your own calculation. I point out that I do this monthly, and have done for about eight years. My latest, for October, is here (it got warmer).
Last time CharlesTM was kind enough to suggest that I submit a post, I described how Australian data made its way, visible at all stages, from the 30-minute readings (reported with about 5 min delay) to the collection point as a CLIMAT form, from where it goes unchanged into GHCN unadjusted (qcu). You can see the world’s CLIMAT forms here; countries vary as to how they report the intermediate steps, but almost all the data comes from AWS, and is reported at the time soon after recording. So GHCN unadjusted, which is one of the data sources I use, can be verified. The other, ERSST v5, is not so easy, but there is a lot of its provenance available.
My calculation is based on GHCN unadjusted. That isn’t because I think the adjustments are unjustified, but rather because I find adjustment makes little difference, and I think it is useful to show that.
I’ll describe the methods and results, but firstly I should address that much-argued question of why use anomalies.
This story was previously discussed here at WUWT… But, why wasn’t this headline news in the Washington Post, New York Times, etc.? Yes… That was a rhetorical question.
…
Comparisons with nearby automated weather stations suggest that air temperatures during these events are near −94 ± 4 °C or about −138 F. Ultracold conditions (below −90 °C) occur more frequently when the Antarctic polar vortex is strong. This temperature appears to be about as low as it is possible to reach, even under clear skies and very dry conditions, because heat radiating from the cold clear air is nearly equal to the heat radiating from the bitterly cold snow surface.
As an indicator of the impacts of climate change, Arctic sea ice is hard to beat. Scientists have observed the frozen polar ocean advance and retreat at this most sensitive region of the Earth over decades for insight on the potential ripple effects on assorted natural systems: global ocean circulation, surrounding habitats and ecosystems, food sources, sea levels and more.
…
“We’re mostly interested in the period from the early 2000s to the present day, where we see such strong melting,” said graduate student Ian Baxter, who also works with Ding. It’s known, he added, that the effects of changes in the Arctic are no longer confined to the region and in fact spread to the mid-latitudes — often in the form of cold weather outbreaks. The group is interested in how effects in the tropics could spread beyond that region and affect the Arctic.
Our charmingly incompetent California Governor, Jerry “Moonbeam” Brown, has announced that all climate-change deniers are “definitely contributing” to the wildfires in the northern and southern parts of the state over the past few days, as well as blazes “in the coming years.” So look out, you dang “deniers”, it’s all your fault!
…
So … did scientists actually “predict” that past temperatures have gone up by one degree? Can scientists actually predict the past? And can we really expect half a degree of warming in the next decade? To get some perspective on these questions, I thought I’d take a look at the records. I found an interesting site, the Western Regional Climate Center (WRCC), which has a variety of weather-related data state by state. So with no further ado, here is the average temperature in California from January of 1895 to the present, October 2018.
…
La géologie, une science plus que passionnante … et diverse
