A landmark paper by warmist scientists in Nature Geosciencenow concedes the world has indeed not warmed as predicted, thanks to a slowdown in the first 15 years of this century. One of its authors, Michael Grubb, professor of international energy and climate change at University College London, admits his past predictions of runaway warming were too alarmist.
“When the facts change, I change my mind. We are in a better place than I thought.”
ANOTHER author, Myles Allen, professor of geosystem science at Oxford, confessed that too many of the mathematical models used by climate scientists to predict future warming “were on the hot side” — meaning they exaggerated.
“We haven’t seen that rapid acceleration in warming after 2000 that we see in the models.”
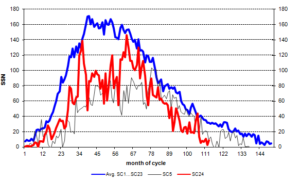
The sun was inactive in April, as we currently find ourselves in the minimum between solar cycle (SC) 24 and the coming solar cycle 25.
The recorded mean sunspot number (SSN) for April was 8.9, which is only 28% of what is usual 113 months into a solar cycle. In April, 16 days were spotless. The following chart shows sunspot activity (…)
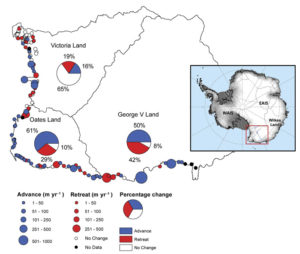
In describing their findings, Lovell et al. state that “between 1972 and 2013, 36% of glacier termini in the entire study area advanced and 25% of glacier termini retreated, with the remainder showing no discernible change outside of the measurement error (± 66 m or ± 1.6 m yr-1) and classified as ‘no change'” (see figure below). Although there were some regional differences in glacier termini changes, these regions over the last four decades were more closely linked to non-climatic drivers, such as terminus type and geometry, than any obvious climatic or oceanic forcing.”
Writing as background for their study, Duvat et al. (2017) state that “it has commonly been considered that atoll reef islands would disappear under climate change, as a result of sea-level rise and induced accelerating shoreline erosion,” citing the works of Connell (2003), Dickinson (2009) and McAdam (2010). This perception is based on model predictions, which have been hyped all over the globe, especially among politicians and the media, some of whom demand reparations for small island States who they fear will be forced to abandon their islands within decades.
But how much faith should one place in such projections and concerns?
Have you been keeping an eye on Sol lately? One of the top astronomy stories for 2018 may be what’s not happening, and how inactive our host star has become.
The strange tale of Solar Cycle #24 is ending with an expected whimper: as of May 8th, the Earthward face of the Sun had been spotless for 73 out of 128 days thus far for 2018, or more than 57% of the time. This wasn’t entirely unexpected, as the solar minimum between solar cycle #23 and #24 saw 260 spotless days in 2009 – the most recorded in a single year since 1913.
Cycle #24 got off to a late and sputtering start, and though it produced some whopper sunspots reminiscent of the Sol we knew and loved on 20th century cycles past, it was a chronic under-performer overall. Mid-2018 may see the end of cycle #24 and the start of Cycle #25… or will it?
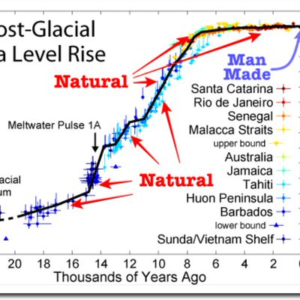
In Figure 29 of that paper, Hansen claims to show that sea level rise has been accelerating, from 0.6 mm/year from 1900 to 1930, to 1.4 mm/year from 1930 to 1992, and 2.6 mm/year from 1993 to 2015.
by Li M. et al., 2017 in CO2Science/Int.J.Biometeorology
In discussing the characteristics of their three-century temperature proxy, the authors report the existence of two prominent decadal-scale cold periods (1801-1833 and 1961-2003) and two prominent decadal-scale warm periods (1730-1800 and 1928-1960). They also note that “fifteen extreme cold years (< -1.5σ) were identified and most occurred within 1-2 years after major volcanic eruptions,” contrasting with the finding that the two decadal-scale warm periods both occurred during “gaps in volcanic activities.”
Perhaps the most significant observation made by the authors, however, is that “none of the extreme warm years [< 1.5σ] or decades occurred in the most recent 30 years,” which fact runs counter to anthropogenic global warming claims that temperatures of the past few decades have been the warmest of the past thousand years (…)
Iran’s deputy environment chief Karim Shafie has warned that Iran’s participation in the Paris Agreement is at risk if they don’t get their climate money.
by Tony Heller, May 22, 2018 in TheDeplorableClimateScienceBlog
Settled science at NASA means constantly rewriting the past. Here are a few of the NASA Reykjavik, Iceland temperature graphs I have captured over the past six years.
Al Gore wrote in the Huffington Post (August 28, 2014) that the need for “bold action” to curtail “old dirty sources of energy … is obvious and urgent.” The proper scientific response to an assertion like that is why? How can I test this idea? Science is not a belief, it is a method of testing ideas. We use an idea to make predictions and then we gather data to see if the predictions are correct. If the predictions are accurate, the idea survives. If any of the predictions fail, the idea is disproven, and it must be modified or simply rejected.
Thanks to GWPF for publishing posthumously Bill Gray’s understanding of global warming/climate change. The paper was compiled at his request, completed and now available as Flaws in applying greenhouse warming to Climate Variability This post provides some excerpts in italics with my bolds and some headers. Readers will learn much from the entire document (title above is link to pdf).
The Fundamental Correction
The critical argument that is made by many in the global climate modeling (GCM) community is that an increase in CO2 warming leads to an increase in atmospheric water vapor, resulting in more warming from the absorption of outgoing infrared radiation (IR) by the water vapor (…)
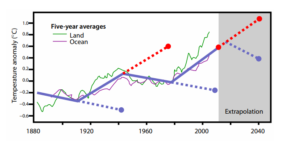
Figure 14: Global surface temperature change since 1880. The dotted blue and dotted red lines illustrate how much error one would have made by extrapolating a multi-decadal cooling or warming trend beyond a typical 25-35 year period. Note the recent 1975-2000 warming trend has not continued, and the global temperature remained relatively constant until 2014.
The effects of past land-cover changes on climate are disputed. Previous modelling studies have generally concluded that the biogeophysical effects of historical deforestation led to an annual mean cooling in the northern mid-latitudes, in line with the albedo-induced negative radiative forcing from land-cover changes since pre-industrial time reported in the most recent Intergovernmental Panel on Climate Change report. However, further observational and modelling studies have highlighted strong seasonal and diurnal contrasts in the temperature response to deforestation
I should know. I’m a former climate research scientist at Environment Canada. And I was an expert reviewer for the United Nations’ International Panel on Climate Change (IPCC) and its 2007 Climate Change Report.
The wintry weather held its grip over most of Canada well into April, from Vancouver to St. John’s, as snow, freezing rain, ice pellets and ferocious winds hammered everyone. A few noteworthy wintry tales:
Calgary is set for record snowfall.
Edmonton set a record for continuous days of below-freezing temperatures this winter.
Most of the Canadian Prairies were still in winter-like weather mode in mid-April.
Toronto has recorded one of the highest numbers of Heating Degree Days at 3,485 and counting.
Atlantic Canada braced for more wintry weather with snow accumulation of 10 to 25 cm in mid-month.
This year’s winter could be the longest, snowiest and coldest in 40 years.
By investigating fossils, Prof. Kießling and Dr. Carl Reddin, who is also at GeoZentrum Nordbayern, have shown that coral, molluscs, and sponges have been following their preferred cold and warm zones for half a billion years. Isotherms (geographic lines denoting the same temperature, for example 20°C) shift towards the poles or the equator as soon as the global temperature rises or decreases. Isotherms have been shifting towards the poles for several years due to global warming.
The tendency towards climate-related migration is most apparent in tropical species. This may be due to the fact that several of these species live near the thermal maximum for complex organisms of 35-45°C . Current global warming trends are driving marine animals towards the poles, provided there is a suitable habitat they can migrate to.
The researchers claim adding historical data derived fudge factors to correct the discrepancy between climate models and historical observations, producing a Frankenmodel mix of fudge factors and defective physics, will make climate predictions more reliable (…)
by Fred Singer, May 15, 2018 in TheWallStreetJournal
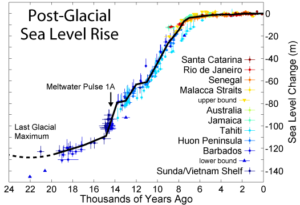
It is generally thought that sea-level rise accelerates mainly by thermal expansion of sea water, the so-called steric component. But by studying a very short time interval, it is possible to sidestep most of the complications, like “isostatic adjustment” of the shoreline (as continents rise after the overlying ice has melted) and “subsidence” of the shoreline (as ground water and minerals are extracted).
I chose to assess the sea-level trend from 1915-45, when a genuine, independently confirmed warming of approximately 0.5 degree Celsius occurred. I note particularly that sea-level rise is not affected by the warming; it continues at the same rate, 1.8 millimeters a year, according to a 1990 review by Andrew S. Trupin and John Wahr. I therefore conclude—contrary to the general wisdom—that the temperature of sea water has no direct effect on sea-level rise. That means neither does the atmospheric content of carbon dioxide.
NASA says the greening of the planet is due to increased CO2, these guys are arguing against that, saying increased forest growth “correlates strongly to the UN Development Programme’s Human Development Index”. Riiiighht. They say that “Europe’s early turnaround and expansion of forest resources obviously can’t be attributed to the rapid rise of atmospheric carbon dioxide that began decades later”. By the same token, the U.N. didn’t exist until decades later, and they sure as hell haven’t had any impact on the greening of the Eastern United States as shown in their map below (…)
Two weeks of climate talks organized by the United Nations finished with developing countries demanding more clarity from their richer counterparts on when a promised package of $100 billion in aid will materialize.
Envoys from almost 200 nations are leaving Bonn, Germany, on Thursday without producing a draft negotiating text for ministers to discuss at the end of the year. Instead, they planned another round of negotiations in Bangkok before their annual conference in Poland in December.
The holdup threatens to unravel three years of work to complete the Paris Agreement, a landmark deal reached in 2015 that set out an ambition to limit fossil-fuel pollution in all nations for the first time (…)
During 2017, there were 150 graphs from 122 scientific papers published in peer-reviewed journals indicating modern temperatures are not unprecedented, unusual, or hockey-stick-shaped — nor do they fall outside the range of natural variability. We are a little over 4 months into the new publication year and already 81 graphs from 62 scientific papers undermine claims that modern era warming is climatically unusual.
by Tony Heller, May 12, 2012 in TheDeplorableClimSciBlog
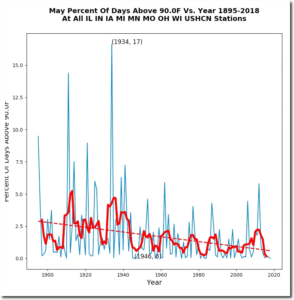
Ninety-five degree temperatures were common in the Midwest during May prior to 1940, but almost never happen any more. May afternoon temperatures have been declining in the Midwest since the 19th century. The hottest May (by far) was 1934, when 100 degree temperatures were widespread across the Midwest, including 101 degrees at Algona, Iowa on May 7th, 1934.
Why do U.S. climate forecasters pay so much attention to a pattern that operates in the remote tropical Pacific? Because the Pacific is the world’s biggest ocean, and disruptions to its climate have a long reach. The seesawing changes in tropical rainfall, winds, and ocean temperature that accompany La Niña and its warm-phase partner, El Niño, trigger a cascade of potentially predictable impacts on seasonal climate in the United States and beyond.
La géologie, une science plus que passionnante … et diverse
