by P. Homewood, Mar 14, 2024 in NotaLotofPeopleKnowThat
The Australian Environment foundation (AEF), which is a farmer friendly conservation group, has issued a new report entitled “State of the Great Barrier Reef 2024.”
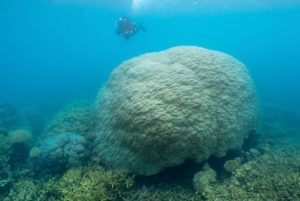
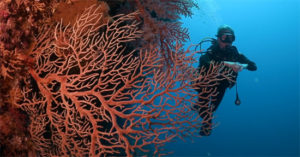
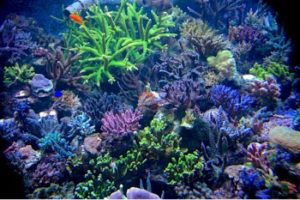
Peter Ridd, the Chairman of the AEF, said the report shows that the reef is in excellent condition with record amounts of coral. “Despite all the catastrophism about hot water bleaching events in the last decade, the species most susceptible to bleaching, (the plate and staghorn corals), have exploded in number. Sadly, the impact of bleaching is routinely exaggerated by the media and some science organisations.”
“The impact of farm pollution in the Reef is negligible and all 3000 individual reefs have excellent coral. No other Australian ecosystem has shown such little change in modern times” Ridd said.
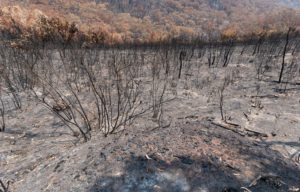
Peter Ridd added, “Australia spends roughly $500 million each year to “save the reef” but this money could be much better spent on genuine environmental problems such as control of invasive weeds and feral animals, or restoring indigenous fire practices into forests and rangeland”.
He concluded, “The public is being deceived about the reef. How this occurred is a serious issue for the reef-science community which has embraced emotion, ideology, and raw self-interest to maintain funding”.
“This new report distils a great deal of data about the reef” said Ridd “it is time that the reef
science institutions confront this data rather than ignoring it and hoping nobody will notice. I challenge them to a public science duel – any time any place.”
The Great Barrier Reef is the largest reef system in the world, and scientists have been warning of its imminent demise since the 1960s.
The report is here.

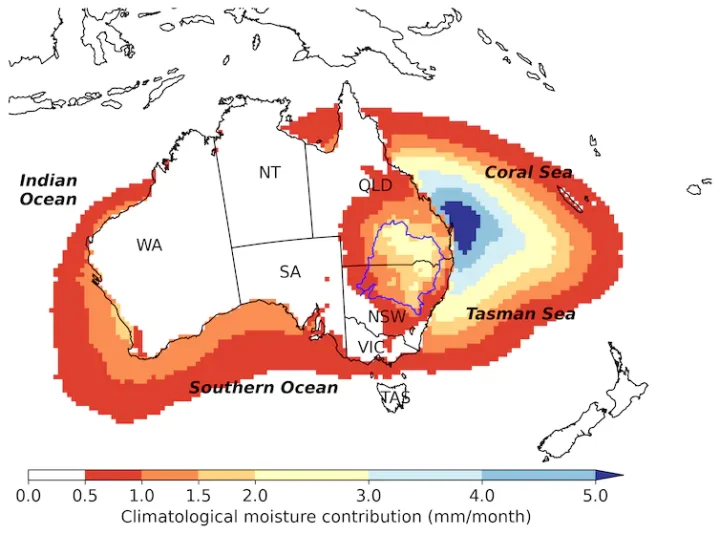 Sources of moisture in eastern Australia. Source: Holgate et al, 2020…