by A. Watts, Nov 19,2024 in ClimateChaneDispatch
On Monday, November 18, The Guardian published an “explainer” piece titled “How do we know that the climate crisis is to blame for extreme weather?” This is false. [emphasis, links added]
Actual data on extreme weather does not support their claim, and the claim is mostly based on flawed “attribution studies.”
The narrative that severe weather events are worsening due to climate change has become a mainstay in today’s media. However, a closer look at the data and the science behind these claims often reveals inconsistencies that should give us pause.
Attribution studies, which are widely used to link specific extreme weather events to climate change, frequently lack rigorous peer review and are published hastily to garner headlines, raising significant concerns about their reliability.
Attribution studies work by using climate models to simulate two different worlds: one influenced by human-caused climate change and another without it. These models then assess the likelihood of extreme weather events in each world.
Yet the validity of such studies is only as good as the models and assumptions underpinning them.
This methodology is prone to overestimating risks because climate models often reflect overheated worst-case scenarios rather than actual observations.
Moreover, these studies are often published without proper peer review. Climate Realism has documented how media outlets run stories based on these model-driven studies, ignoring real-world data that often contradicts the alarming conclusions.
For example, articles frequently cite reports that heatwaves, floods, or hurricanes are “worsening” without disclosing that these claims rely on theoretical simulations rather than measured evidence.
Empirical data does not support claims of worsening severe weather. In fact, long-term trends for many extreme weather events have remained stable or even declined.
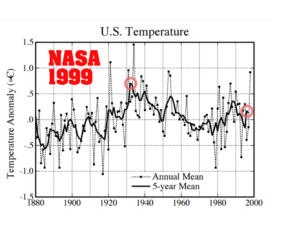
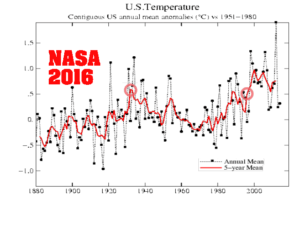
According to Climate at a Glance, heatwaves in the United States were most severe in the 1930s, with temperatures and frequency outstripping recent records.
The number of strong hurricanes making landfall in the United States has not increased either. The country even experienced a record 12-year lull in major hurricanes between 2005 and 2017.
Additionally, droughts have not intensified in the U.S. The nation saw historically low levels of drought in recent years, with 2017 and 2019 setting records for the smallest percentage of the country affected by drought. These data points highlight a crucial disconnect between what is reported and what is actually happening.
…