Archives par mot-clé : CO2 Emissions

2020 Review: Observational And Modeling Studies Show Temperature Falls As CO2 Rises

by K. Richard, Dec 28, 2020 in NoTricksZone


A 2020 observational study (Zhang et al., 2020) determined “temperatures of atmospheric air with substantially higher CO2 concentration (ranging from 3200 ppm to 16,900 ppm) were lower than that with the lower CO2 concentration (480 ppm)” and a 2020 modeling study (Drotos et al., 2020) assessed that when CO2 goes beyond 4 times preindustrial – 1,120 ppm – “climate sensitivity decreases to nearly zero” because the climate cyclically cools by 10 K.

So the science is settled, right?


….

Covid-19 et émissions de CO2

by Prof. Jean N., Dec. 1, 2020 in ScienceClimatEnergie


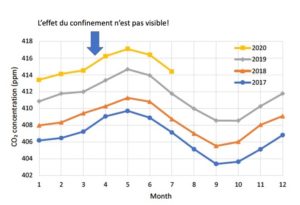
Début avril 2020, sans que personne ne s’en rende compte, une expérience scientifique très intéressante a été menée, et ce de manière involontaire. En effet, 3,9 milliards de personnes dans le monde ont été placées en confinement suite à l’expansion du virus Covid-19. Il en a résulté une très forte diminution du trafic aérien et automobile accompagné d’une fermeture temporaire de nombreuses industries dans le monde entier. Cette expérience a évidemment provoqué une chute drastique des émissions de CO2 anthropique. Mais pendant l’expérience, les détecteurs mesurant le taux de CO2 atmosphérique ont continué à tourner. Nous disposons maintenant des résultats. Cette diminution abrupte des émissions a-t-elle eu un impact sur le taux de CO2 atmosphérique, ou sur la température globale? C’est ce dont nous allons discuter dans le présent article.

1. Bref rappel concernant la mesure du taux de CO2 atmosphérique.

L’observatoire de Mauna Loa à Hawaii est l’un des plus célèbres sites mesurant en continu le taux de CO2 atmosphérique. Ce taux est mesuré avec précision depuis 1959 par une méthode de spectrométrie infra-rouges, et depuis 2019 par la méthode CRDS (Cavity Ring-Down Spectroscopy). La courbe obtenue est croissante avec des oscillations régulières (Figure 1). De ± 320 ppm en 1959 on arrive à ± 410 ppm en 2020. SCE a d’ailleurs publié une suite d’articles sur ce sujet[1].

Figure 3. Taux de CO2 mesuré à Mauna Loa depuis 2017. Source : Koutsoyiannis & Kundzewicz (2020) Sci 2020, 2, 72

….

Carbon dioxide levels continue at record levels, despite COVID-19 lockdown

by WMO, Nov 23, 20°20


2020 Trends

The Global Carbon Project estimated that during the most intense period of the shutdown, daily CO2 emissions may have been reduced by up to 17% globally due to the confinement of the population. As the duration and severity of confinement measures remain unclear, the prediction of the total annual emission reduction over 2020 is very uncertain.


Dubai builds first coal power plant despite pledging lowest carbon footprint in the world by 2050

by Independent, Oct 22, 2020


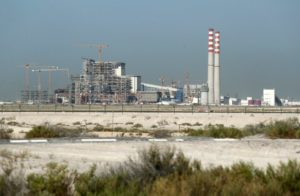
A new wonder is rising in the southern desert of Dubai against the backdrop of Persian Gulf beaches, but it’s not another skyscraper to grace the futuristic sheikhdom. Instead, it’s one of mankind’s oldest power sources gaining its own space on the oil-rich Arabian Peninsula — a coal-fired power plant

The construction of the $3.4 billion Hassyan plant in Dubai appears puzzling, as the United Arab Emirates hosts the headquarters of the International Renewable Energy Agency. It’s also building the peninsula’s first nuclear power plant and endlessly promotes its vast solar-power plant named after Dubai’s ruler. Dubai has also set the lofty goal of having the world’s lowest carbon footprint in the world by 2050 — something that would be impacted by burning coal.

The coal plant’s arrival comes as Gulf Arab nations remain among the world’s hungriest for energy and amid political concerns over the use of natural gas imported from abroad, concerns underscored by a yearslong dispute with gas-producer Qatar, which is boycotted by four Arab nations, including the UAE.

“Dubai was really saying we’re far too exposed on gas imports, those could be interrupted by all kinds of things, the cost is very high and so we have to do something else to diversify our fuel supply and bring down the total cost,” said Robin Mills, the CEO of Qamar Energy, a Dubai-based consulting company. “They got a very competitive offer on the coal plant … and so the decision was made.”

Is Mauna Loa Really The Best Location To Measure ‘Global’ CO2 Levels?

by K. Richard, Oct 19, 2020 in NoTricksZone


Highly anomalous terrain (an active volcano), 40 years of cooling temperatures, and a CO2 record that dramatically contrasts with fluctuating values from forests and meadows reaching 600-900 ppm all beg the question: Is Mauna Loa’s CO2 record globally representative?

Mauna Loa is the Earth’s largest land volcano. It has erupted over 3 dozen times since 1843, making this terrestrial landscape extremely unusual relative to the rest of the globe’s terrain. (Forests, in contrast, cover over 30% of the Earth’s  land surface.)

Mauna Loa has been thought to be the world’s best location to monitor global CO2 levels since 1958.

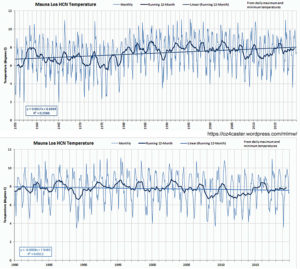
While Mauna Loa CO2 levels show a rise of 338 ppm to 415 ppm since 1980, Mauna Loa temperatures (HCN) show a cooling trend during this same time period. The only warming period in the last 65 years occurred between about 1975 and 1985.

Image Source: oz4caster

Forest CO2 fluctuations

As mentioned above, forests are orders of magnitude more terrestrially representative than the highly anomalous site of the Earth’s largest volcano.

In forests or tree-covered areas, CO2 rises from around 300 ppm in the warmth of the afternoon (~3 p.m.) to over 600 ppm before sunrise (~4 a.m.), when it is cooler (Fennici, 1986, Hamacher et al., 1994). This massive fluctuation occurs daily and CO2 values average out to be far higher than the Mauna Loa record suggests.

Study: Renewable Energy does Nothing to Reduce CO2 Emissions

by E. Worall, Oct 14, 2020 in WUWT


h/t Dr. Willie Soon / James Delingpole / Breitbart; A group of high profile scientists, including Dr. Willie Soon, have published a meticulously referenced study which discuses the pros and cons of various CO2 reduction strategies.


The abstract of the study:

Energy and Climate Policy—An Evaluation of Global Climate Change Expenditure 2011–2018 

by Coilín ÓhAiseadha 1,*Gerré Quinn 2Ronan Connolly 3,4Michael Connolly 3 and Willie Soon 4

1 Department of Public Health, Health Service Executive, Dr Steevens’ Hospital, D08 W2A8 Dublin 8, Ireland
2 Centre for Molecular Biosciences, Ulster University, Coleraine BT521SA, Northern Ireland, UK
3 Independent Scientists, Dublin 8, Ireland
4 Center for Environmental Research and Earth Sciences (CERES), Salem, MA 01970, USA*Author to whom correspondence should be addressed.

Concern for climate change is one of the drivers of new, transitional energy policies oriented towards economic growth and energy security, along with reduced greenhouse gas (GHG) emissions and preservation of biodiversity. Since 2010, the Climate Policy Initiative (CPI) has been publishing annual Global Landscape of Climate Finance reports. According to these reports, US$3660 billion has been spent on global climate change projects over the period 2011–2018. Fifty-five percent of this expenditure has gone to wind and solar energy. According to world energy reports, the contribution of wind and solar to world energy consumption has increased from 0.5% to 3% over this period. Meanwhile, coal, oil, and gas continue to supply 85% of the world’s energy consumption, with hydroelectricity and nuclear providing most of the remainder. With this in mind, we consider the potential engineering challenges and environmental and socioeconomic impacts of the main energy sources (old and new). We find that the literature raises many concerns about the engineering feasibility as well as environmental impacts of wind and solar. However, none of the current or proposed energy sources is a “panacea”. Rather, each technology has pros and cons, and policy-makers should be aware of the cons as well as the pros when making energy policy decisions. We urge policy-makers to identify which priorities are most important to them, and which priorities they are prepared to compromise on.

Read more: https://www.mdpi.com/1996-1073/13/18/4839/htm

Corona-induced CO2 emission reductions are not yet detectable in the atmosphere

by Karlsruher Institut für Technology, Sep 21, 2020 in EurekAlert


Based on current data measured in the energy, industry, and mobility sectors, restrictions of social life during the corona pandemic can be predicted to lead to a reduction of worldwide carbon dioxide emissions by up to eight percent in 2020. According to the Intergovernmental Panel on Climate Change (IPCC), cumulative reductions of about this magnitude would be required every year to reach the goals of the Paris Agreement by 2030. Recent measurements by researchers of Karlsruhe Institute of Technology (KIT) revealed that concentration of carbon dioxide (CO2) in the atmosphere has not yet changed due to the estimated emission reductions. The results are reported in Remote Sensing (DOI: 10.3390/rs12152387).


See also here =  Can We Measure a COVID-19-Related Slowdown in Atmospheric CO2 Growth? Sensitivity of Total Carbon Column Observations

Sector by sector: where do global greenhouse gas emissions come from?

by H. Ritchie, Sep 18, 2020, in OurWorldlinData


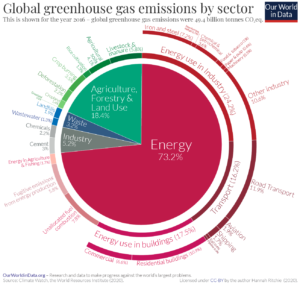
To prevent severe climate change we need to rapidly reduce global greenhouse gas emissions. The world emits around 50 billion tonnes of greenhouse gases each year [measured in carbon dioxide equivalents (CO2eq)].

To figure out how we can most effectively reduce emissions and what emissions can and can’t be eliminated with current technologies, we need to first understand where our emissions come from.

In this post I present only one chart, but it is an important one – it shows the breakdown of global greenhouse gas emissions in 2016. This is the latest breakdown of global emissions by sector, published by Climate Watch and the World Resources Institute.,

The overall picture you see from this diagram is that almost three-quarters of emissions come from energy use; almost one-fifth from agriculture and land use  [this increases to one-quarter when we consider the food system as a whole – including processing, packaging, transport and retail]; and the remaining 8% from industry and waste.

To know what’s included in each sector category, I provide a short description of each. These descriptions are based on explanations provided in the IPCC’s Fifth Assessment Report AR5) and a methodology paper published by the World Resources Institute.,

Atmospheric CO2 during the Mid-Piacenzian Warm Period and the M2 glaciation

by de la Vega et al., 2020 in Nature OPEN  ACCESS


Abstract

The Piacenzian stage of the Pliocene (2.6 to 3.6 Ma) is the most recent past interval of sustained global warmth with mean global temperatures markedly higher (by ~2–3 °C) than today. Quantifying CO2 levels during the mid-Piacenzian Warm Period (mPWP) provides a means, therefore, to deepen our understanding of Earth System behaviour in a warm climate state. Here we present a new high-resolution record of atmospheric CO2 using the δ11B-pH proxy from 3.35 to 3.15 million years ago (Ma) at a temporal resolution of 1 sample per 3–6 thousand years (kyrs). Our study interval covers both the coolest marine isotope stage of the mPWP, M2 (~3.3 Ma) and the transition into its warmest phase including interglacial KM5c (centered on ~3.205 Ma) which has a similar orbital configuration to present. We find that CO2 ranged from 389+388389−8+38ppm to 331+1311,331−11+13,ppm, with CO2 during the KM5c interglacial being 371+3229371−29+32ppm (at 95% confidence). Our findings corroborate the idea that changes in atmospheric CO2 levels played a distinct role in climate variability during the mPWP. They also facilitate ongoing data-model comparisons and suggest that, at present rates of human emissions, there will be more CO2 in Earth’s atmosphere by 2025 than at any time in at least the last 3.3 million years.

COVID-19 Global Economic Downturn not Affecting CO2 Rise: May 2020 Update

by Roy Spencer, June 5, 2020 in GlobalWarming


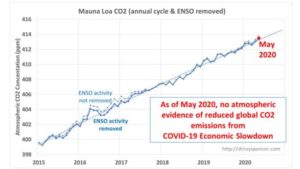
The Mauna Loa atmospheric CO2 concentration data continue to show no reduction in the rate of rise due to the recent global economic slowdown. This demonstrates how difficult it is to reduce global CO2 emissions without causing a major disruption to the global economy and exacerbation of poverty.

After removal of the strong seasonal cycle in Mauna Loa CO2 data, and a first order estimate of the CO2 influence of El Nino and La Nina activity (ENSO), the May 2020 update shows no indication of a reduction in the rate of rise in the last few months, when the reduction in economic activity should have shown up.

I had previously explained why the slowdown would likely not be large enough to affect measured atmospheric CO2 levels compared to natural variations in global sources and sinks of CO2. I calculated that the Energy Information Administration-estimated 11% reductions in CO2 emissions during 2020 would have to be four times larger to stop the rise of atmospheric CO2 over 2019 values (assuming no substantial natural variations in CO2 sources and sinks).

See also

Global Economic Downturn Not Affecting CO2 Rise: May 2020

Quarantines, Lockdowns Had No Impact On Global CO2 Levels

by Climate at a Glance, June 1, 2020 in ClimateChangeDispatch


The COVID-19, aka Coronavirus pandemic, is causing a worldwide shutdown in economic activity as businesses close, airlines cancel flights, energy production is reduced, and people shelter in their homes and drive less.

Climate activists expected this economic downtown to translate to less energy usage, and therefore less CO2 emissions globally.

While that has indeed happened, with China seeing a 40% emissions drop, and an expected 11% reduction in energy-related CO2 emissions in the U.S. this year, it didn’t translate into the proof they were seeking.

What scientists are looking for is any evidence of a decline in global atmospheric CO2 concentrations that would be strong enough to attribute to the economic downturn.

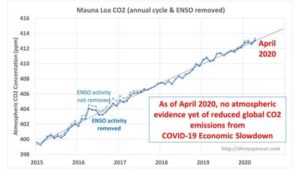
University of Alabama climate scientist Dr. Roy Spencer used a simple method1 for removing the large seasonal CO2 cycle2, due to plant photosynthesis increases/decreases with seasons, from the Mauna Loa CO2 data, and well as the average effects from El Nino and La Nina events, which change the rate of ocean outgassing of CO2.

The result: no obvious downtown in global CO2 levels has been observed3,4.

As can be seen in Figure 1, the latest CO2 data show no downtrend, but instead just a ripple, that is not unlike other ripples in the graph when there was no crisis and resulting economic downturn.

Figure 1: Using a simple method1 for removing the large seasonal cycle from the Mauna Loa CO2 data, and well as the average effects from El Nino and La Nina events, no obvious downtown in global CO2 levels has been observed4. Analysis by Dr. Roy Spencer.


Destroying the environment to save it

by Ch. Rotter, May 31, 2020 in WUWT


Pseudo-green energy will wreak devastation, pretending to prevent exaggerated climate harm

Paul Driessen

“We had to destroy the village in order to save it.” The infamous Vietnam era quotation may or may not have been uttered by an anonymous US Army major. It may have been misquoted, revised, apocryphal or invented. But it quickly morphed into an anti-war mantra that reflected attitudes of the time.

For Virginians and others forced to travel the path of “clean, green, renewable, sustainable” energy, it will redound in modern politics as “We had to destroy the environment in order to save it.”

Weeks after Governor Ralph Northam signed Virginia’s “Clean Economy Act,” which had been rushed through a partisan Democrat legislature, Dominion Energy Virginia announced it would reach “net zero” greenhouse gas emissions by 2050. To do so, the utility company will raise family, business, hospital and school electricity bills by 3% every year for the next ten years – as these customers and state and local governments struggle to climb out of the financial holes created by the ongoing Coronavirus lockdown.

Just as bad, renewable energy mandates and commitments from the new law and Dominion’s “integrated resource plan” will have major adverse impacts on Virginia and world environmental values. In reality, Virginia’s new “clean” economy exists only in fantasy land – and only if we ignore “clean” energy CO2 emissions, air and water pollution, and other environmental degradation around the world.

Dominion Energy plans to expand the state’s offshore wind, onshore solar and battery storage capacity by some 24,000 megawatts of new “renewable” energy by 2035, and far more after that. It will retain just 9,700 MW of existing natural gas generation, and only through 2045, build no new gas-fired units, and retire 6,200 megawatts of coal-fired generation. This will reduce in-state carbon dioxide emissions, but certainly won’t do so globally. The company intends to keep its four existing nuclear units operating.

To “replace” some of its abundant, reliable, affordable fossil fuel electricity, Dominion intends to build at least 31,400 megawatts of expensive, unreliable solar capacity by 2045. The company estimates that will require a land area some 25% larger than 250,000-acre Fairfax County, west of Washington, DC. That means Dominion Energy’s new solar facilities will blanket 490 square miles (313,000 acres) of beautiful croplands, scenic areas and habitats that now teem with wildlife.

The Global CO2 lockdown problem

by Sherrington G., May 22, 2020 in WUWT


The global problem.

In response to the threat of a global viral epidemic, countries announced lockdowns at various times near 25th March 2020. https://en.wikipedia.org/wiki/COVID-19_pandemic_lockdowns

This caused a reduction of industrial activity and hence a lower rate of emission of anthropogenic carbon dioxide to the atmosphere. An example of reduction from aircraft is given at https://en.wikipedia.org/wiki/Impact_of_the_COVID-19_pandemic_on_aviation

Numerous sources asked if the reduction in CO2 emission could be detected in analysis of air for CO2 content, which had been done for decades. Early questions and speculative answers came from many sources including –

https://www.esrl.noaa.gov/gmd/ccgg/covid2.html

https://www.aljazeera.com/news/2020/03/coronavirus-lockdown-leads-improved-air-quality-200322094404592.html

By late May 2020, the emerging consensus was that the reduction would be too small to show at the main measuring stations such as Mauna Loa, Hawaii.

Why the Current Economic Slowdown Won’t Show Up in the Atmospheric CO2 Record

by Rotter, from Spencer, May 15, 2020 in WUWT


May 15th, 2020 by Roy W. Spencer, Ph. D.

[UPDATE: MISSING IMAGES INSERTED]

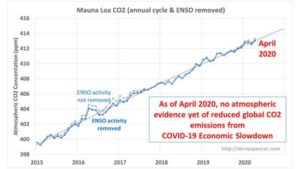
Summary: Atmospheric levels of carbon dioxide (CO2) continue to increase with no sign of the global economic slowdown in response to the spread of COVID-19. This is because the estimated reductions in CO2 emissions (around -11% globally during 2020) is too small a reduction to be noticed against a background of large natural variability. The reduction in economic activity would have to be 4 times larger than 11% to halt the rise in atmospheric CO2.

Changes in the atmospheric reservoir of CO2 occur when there is an imbalance between surface sources and sinks of CO2. While the global land and ocean areas emit approximately 30 times as much CO2 into the atmosphere as humans produce from burning of fossil fuels, they also absorb about an equal amount of CO2. This is the global carbon cycle, driven mostly by biological activity.

Fig. 2. Monthly CO2 data since 2015 from Mauna Loa, HI after the average seasonal cycle is statistically removed.

ADDENDUM: How much of a decrease in CO2 emissions would be required to stop the atmospheric rise in CO2?


Continuer la lecture de Why the Current Economic Slowdown Won’t Show Up in the Atmospheric CO2 Record

Study: CO2 Emissions From Dry Inland Waters Much Higher Than Thought

by Ufz, Mau 1, 2020 in ClimateChangeDispatch


Inland waters such as rivers, lakes, and reservoirs play an important role in the global carbon cycle.

Calculations that scale up the carbon dioxide emissions from land and water surface areas do not take account of inland waters that dry out intermittently.

This means that the actual emissions from inland waters have been significantly underestimated—as shown by the results of a recent international research project led by scientists at the Helmholtz Centre for Environmental Research (UFZ) in Magdeburg and the Catalan Institute for Water Research (ICRA).

The study was published in Nature Communications.


“The interaction of local conditions like temperature, moisture, and the organic matter content of the sediments is crucial, and it has a bigger influence than regional climate conditions,” Keller explains.

So what do the results of the study mean for the future assessment of carbon dioxide emissions from inland waters? “Our study shows that carbon dioxide emissions from inland waters have been significantly underestimated up until now,” says Koschorreck.

THE UN ADMITS THAT THE PARIS CLIMATE DEAL WAS A FRAUD

by Poppallov, February 24, 2020 in Electroverse


In an editorial piece published in the Investor’s Business Daily Saturday 11th February 2017, we are told about a United Nations climate report that environmentalists undoubtedly don’t want anybody to read. It states in plain English “that even if every country abides by the grand promises they made last year in Paris to reduce greenhouse gases, the planet would still be doomed…”

When President Obama hitched America to the Paris accords in 2016, he declared that it was “the moment that we finally decided to save our planet.” And when Trump pulled out of the deal this year, he was berated by legions of environmentalists for killing it.

But it turns out that the Paris accord was little more than a sham that will do nothing to “save the planet.”

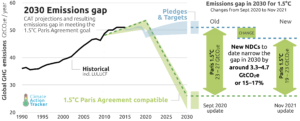
According to the latest annual UN report on the “emissions gap,” the Paris agreement will provide only a third of the cuts in greenhouse gas that environmentalists claim is needed to prevent catastrophic warming. If every country involved in those accords abides by their pledges between now and 2030 — which is a dubious proposition — temperatures will still rise by 3 degrees Celsius by 2100. The goal of the Paris agreement was to keep the global temperature increase to under 2 degrees.

The measures submitted included: “Boosting renewable energy’s share to 30%. Pushing electric cars to 15% of new car sales, up from less than 1% today. Doubling mass transit use. Cutting air travel CO2 emissions by 20%. And coming up with $1 trillion for “climate action.”

Central to the report, “phasing out coal consumption … is an indispensable condition for achieving international climate change targets.” That means halting all new coal plants shutting down those currently in use.

Which is quite a big ask, as there are currently 273 gigawatts of coal capacity under construction around the world, and another 570 gigawatts in the pipeline, according to the UN. That’s a 42% increase in global energy production from coal. Which doesn’t consider the 22 coal-fired power stations to be built at 17 locations in Japan to replace their aging nuclear plants. These new installations will on their own produce more carbon dioxide annually than all the passenger cars sold in the United States each year.

So, with all the hype in the media about “climate change” and with NOAA admitting to data manipulation, as well as acknowledging that the climate has been cooling for the past 10 years, when is the UN going to shut-up shop and call an end to this panhandling charade?

Expert: German Coal Exit Will Cost 80 Billion Euros, But “Changes Europe CO2 Emissions By 0”

by P. Gosselin, February 22, 2020 in NoTricksZone


The German government recently decided to exit from coal generated power by 2038, and now one expert says that the exit is going to cost handsomely, and bring zero result. Still, that 2038 target is too slow for some.

That’s how German politicians make decisions on things that concern the economy and environment. The German government’s aim of a coal phaseout is to contribute to protecting the climate. In reality, it will have no impact at all.

German online FOCUS magazine reports here: “80 billion euros are to be given to the affected regions and companies in the coming years as aid and compensation.”

But for some experts, the 2018 target date for completing the coal exit is too late, and thus risks seeing Germany emitting another 140 million tonnes of extra CO2 between 2020 and 2040 by exiting so slowly, so claims the German Institute for Economic Research (DIW).

To keep that 140 million ton figure in a global perspective, it is barely a drop in the bucket when compared to the 33 billion tonnes emitted globally and annually. The climate is not even going to notice it.


Continuer la lecture de Expert: German Coal Exit Will Cost 80 Billion Euros, But “Changes Europe CO2 Emissions By 0”

Quantifying Futility: an estimate of future Global CO2 emissions

by C. Rotter, February 21, 2020 in WUWT


Reposted from edmhdotme

Following the thinking of the late Prof David Mackay using “back of the envelope calculations”, this post makes estimates of the likely future growth in global CO2 emissions to put the efforts at CO2 emissions reduction in the Western World into the context of a probable and inevitable future for Global CO2 emissions.

Two scenarios are considered.  They set the range of outcomes:

  1. The Underdeveloped world and India presently at a level of ~1.9tonnes/head/annum attain the global average level of CO2 emissions/head/annum of 2018:  4.46tonnes/head/annum.  This results in Global CO2 emissions growing by 18.5Gigatonnes/annum to reach ~52Gigatonnes/annum.  This level is close to the current CO2 emissions/head/annum in France.
  2. The Underdeveloped world and India eventually attain the level of CO2 emissions/head current in China:  6.78tonnes/head/annum.  This level is also close to the average 2018 CO2 emissions/head/annum in the EU(28). This would result in Global CO2 emissions growing by ~33.5Gigatonnes/annum to reach ~67Gigatonnes/annum.

These values set a range of estimates and show how the inevitable CO2 emissions growth in the Developing World would swamp any savings made by Western nations in the name of controlling climate.  This point was amply made by Berkley Professor Richard  Muller in 2010, before he set up the BEST temperature record.  His graph is shown below:  this post just puts some more precise values on the extent that the Underdeveloped world will wholly overwhelm any efforts in the West to reduce Global  CO2 emissions and thus attempt to influence Global temperature.

Physics Professor: CO2’s 0.5°C Impact After Rising To 700 ppm Is So Negligible It’s ‘Effectively Unmeasurable’

by P. Stallinga, February 13, 2020 in NoTricksZone


Dr. Peter Stallinga has published a comprehensive analysis of the Earth’s greenhouse effect. He finds an inconsequential role for CO2.

Doubling CO2 from 350 to 700 ppm yields a warming of less than 0.5°C (500 mK).

Feedbacks to warming are likely negative, as adding CO2 may only serve to speed up natural return-to-equilibrium processes.

As for absorption-reemission perturbation from CO2, “there is nothing CO2 would add to the current heat balance in the atmosphere.”

A portion of Dr. Stallinga’s paper worth highlighting – which he mentions only in passing – refers to the early history of the Earth’s greenhouse effect paradigm.

K. Ångström receives little attention as a pioneer of the conceptualization that warming and cooling resul from radiative imbalances within a planetary greenhouse effect.

About 120 years ago, Ångström (1900) contradicted the oft-cited Arrhenius (1896) – the atmospheric physicist referred to by proponents of anthropogenic global warming.

Ångström suggested Earth’s greenhouse effect is already saturated in its current (1900) state, and therefore increasing CO2 will have “no effect whatsoever” on climate (Stallinga, 2020).

Ångström’s conclusions were largely ignored.

..

Bad news for climate alarmists: global carbon dioxide emissions flatlined in 2019

by A. Watts, February 13, 2020 in WUWT


From the inconvenient data department and the IEA comes this press release.


Despite widespread expectations of another increase, global energy-related carbon dioxide emissions stopped growing in 2019, according to IEA data released today.

After two years of growth, global emissions were unchanged at 33 gigatonnes in 2019 even as the world economy expanded by 2.9%. This was primarily due to declining emissions from electricity generation in advanced economies, thanks to the expanding role of renewable sources (mainly wind and solar), fuel switching from coal to natural gas, and higher nuclear power generation. Other factors included milder weather in several countries, and slower economic growth in some emerging markets.

Continuer la lecture de Bad news for climate alarmists: global carbon dioxide emissions flatlined in 2019

Global Fossil Fuel Emissions Up 0.6% In 2019

by P. Homewood, February 6, 2020 in NotaLotofPeopleKnowThat


Emissions from fossil fuel and industry (FF&I) are expected to reach 36.81bn tonnes of CO2 (GtCO2) in 2019, up by only 0.24GtCO2 (0.6%) from 2018 levels, according to the latest estimates from the Global Carbon Project (GCP).

The data is being published in Earth System Science Data Discussions, Environmental Research Letters and Nature Climate Change to coincide with the UN’s COP25 climate summit in Madrid, Spain.

The growth of global emissions in 2019 was almost entirely due to China, which increased its CO2 output by 0.26GtCO2. The rest of the world actually reduced its emissions by -0.02GtCO2, thanks to falling coal use in the US and Europe, as well as much more modest increases in India and the rest of the world, compared to previous years.

The GCP researchers say that “a further rise in emissions in 2020 is likely” as global consumption of natural gas is “surging”, oil use continues to increase and, overall, energy demand rises.

Despite the rapid rise and falling costs of renewables in many parts of the world, the majority of increases in energy demand continue to be met by fossil fuels. For example, gas met around two-fifths of the increase in demand in 2018, against just a quarter coming from renewables.

Overall, human-caused CO2 emissions, including those from FF&I and land use, are projected to increase by 1.3% in 2019. This is driven by a 0.29GtCO2 (5%) increase in land-use emissions – including deforestation –  which is the fastest rate in five years. While land use only represents around 14% of total 2019 emissions, it will contribute more than half the increase in emissions in 2019.

While more modest than in recent years, the increase in emissions in 2019 puts the world even further away from meeting its climate change goals under the Paris Agreement.

Will Humanity Ever Reach 2XCO2? Possibly Not

by Dr. Roy Spencer, February 2, 2020 in WUWT


Summary

The Energy Information Agency (EIA) projects a growth in energy-based CO2 emissions of +0.6%/yr through 2050. But translating future emissions into atmospheric CO2 concentration requires a global carbon budget model, and we frequently accept the United Nations reliance on such models to tell us how much CO2 will be in the atmosphere for any given CO2 emissions scenario. Using a simple time-dependent CO2 budget model forced with yearly estimates of anthropogenic CO2 emissions and optimized to match Mauna Loa observations, I show that the EIA emissions projections translate into surprisingly low CO2 concentrations by 2050. In fact, assuming constant CO2 emissions after 2050, the atmospheric CO2 content eventually stabilizes at just under 2XCO2.

Introduction

I have always assumed that we are on track for a doubling of atmospheric CO2 (“2XCO2”), if not 3XCO2 or 4XCO2. After all, humanity’s CO2 emissions continue to increase, and even if they stop increasing, won’t atmospheric CO2 continue to rise?

It turns out, the answer is probably “no”.

The rate at which nature removes CO2 from the atmosphere, and what controls that rate, makes all the difference.

Even if we knew exactly what humanity’s future CO2 emissions were going to be, how much Mother Nature takes out of the atmosphere is seldom discussed or questioned. This is the domain of global carbon cycle models which we seldom hear about. We hear about the improbability of the RCP8.5 concentration scenario (which has gone from “business-as-usual”, to “worst case”, to “impossible”), but not much about how those CO2 concentrations were arrived at from CO2 emissions data.

So, I wanted to address the question, What is the best estimate of atmospheric CO2 concentrations through the end of this century, based upon the latest estimates of future CO2 emissions, and taking into account how much nature has been removing from the atmosphere?

As we produce more and more CO2, the amount of CO2 removed by various biological and geophysical processes also goes up. The history of best estimates of yearly anthropogenic CO2 emissions, combined with the observed rise of atmospheric CO2 at Mauna Loa, Hawaii, tells us a lot about how fast nature adjusts to more CO2.

Analysis of a carbon forecast gone wrong: the case of the IPCC FAR

by J. Curry, January 31, 2020 in WUWT-C. Rotter


The IPCC’s First Assessment Report (FAR) made forecasts or projections of future concentrations of carbon dioxide that turned out to be too high.

From 1990 to 2018, the increase in atmospheric CO2 concentrations was about 25% higher in FAR’s Business-as-usual forecast than in reality. More generally, FAR’s Business-as-usual scenario expected much more forcing from greenhouse gases than has actually occurred, because its forecast for the concentration of said gases was too high; this was a problem not only for CO2, but also for methane and for gases regulated by the Montreal Protocol. This was a key reason FAR’s projections of atmospheric warming and sea level rise likewise have been above observations.

Some researchers and commentators have argued that this means FAR’s mistaken projections of atmospheric warming and sea level rise do not stem from errors in physical science and climate modelling. After all, emissions are for climate models an input, not an output. Emissions depend largely on economic growth, and can also be affected by population growth, intentional emission reductions (such as those implemented by the aforementioned Montreal Protocol), and other factors that lie outside the field of physical science. Under this line of reasoning, it makes no sense to blame the IPCC for failing to predict the right amount of atmospheric warming and sea level rise, because that would be the same as blaming it for failing to predict emissions.

Readers who have made it to this part of the article probably want a summary, so here it goes:

  • Hausfather estimates that FAR’s Business-as-usual scenario over-projected forcings for the 1990-2017 period by 55%. This would mean a difference of 0.59 w/m2 between FAR and reality.
  • Lower-than-expected concentrations of Montreal Protocol gases explain about 0.19 w/m2 of the difference. With the big caveat that Montreal Protocol accounting is a mess of CFCs, HCFCs, HFCs, stratospheric ozone, and perhaps other things I’m not even aware of.
  • FAR didn’t account for tropospheric ozone, and this ‘unexplains’ about 0.07 w/m2. So there’s still 0.45-0.5 w/m2 of forcing overshoot coming from something else, if Hausfather’s numbers are correct.
  • N2O is irrelevant in these numbers
  • CO2 concentration was significantly over-forecasted by the IPCC, and that of methane grossly so. It’s safe to assume that methane and CO2 account for most or all of the remaining difference between FAR’s projections and reality.

Again, this is a rough calculation. As mentioned before, an exact calculation has to take into account for many issues I didn’t consider here. I really hope Hausfather’s paper is the beginning of a trend in properly evaluating climate models of the past, and that means properly accounting for (and documenting) how expected forcings and actual forcings differed.

China Burns Over Half Of The World’s Coal And Will Account For 50% Of Global CO2 Emissions By 2030

by K. Richard, December 19, 2019 in NoTricksZone


Today, 30% of the globe’s CO2 emissions come from China. In 10 years, China’s emissions alone will match the rest of world’s emissions combined. China continues to build hundreds of coal plants today. So why are the rest of us spending $600 billion every year on CO2 emissions mitigation?

China overtook the United States as the world’s largest CO2 emitter in 2008 (Liu et al., 2019).

Paris Won’t Cut Emissions–Bob Watson

by P. Homewood, November 10, 2019 in NotaLotofPeople KnowThat


It’s apparently taken ex IPCC Chair Bob Watson four years to work out that the Paris Agreement did nothing to reduce emissions.

It’s a pity he did not read this blog, because I was saying the same thing when it was signed!

Steve Milloy reports:


The truth behind the Paris Agreement climate pledges

Almost 75% of 184 Paris Agreement pledges were judged insufficient to slow climate change; Only 28 European Union nations and 7 others will reduce emissions by at least 40% by 2030

UNIVERSAL ECOLOGICAL FUND

  • Only 28 European Union nations & 7 others will reduce emissions by at least 40 percent by 2030
  • China & India, top emitters, will reduce emissions intensity, but their emissions will increase
  • U.S., second top emitter, has reversed key national policies to combat climate change
  • Almost 70 percent of the pledges rely on funding from wealthy nations for their implementation

Almost three-quarters of the 184 climate pledges made under the Paris Agreement aimed at curbing greenhouse gas emissions are inadequate to slow climate change, and some of the world’s largest emitters will continue to increase emissions, according to a panel of world-class climate scientists. It is these increasing greenhouse emissions that are driving climate change.

The Truth Behind the Climate Pledges, a new report published by the Universal Ecological Fund, examines in great detail the 184 voluntary pledges under the Paris Agreement, the first collective global effort to address climate change.