For the past 30 years, there has been an orchestrated alarm over how much a trace of a trace gas, human-produced carbon dioxide (CO2), impacts earth’s climate.
The idea was presented as the ‘settled science’ and that there exists a ‘greenhouse effect’ in Earth’s atmosphere and that CO2 ‘traps heat’ or ‘delays cooling’.
Besides the ‘official scientists’ who have convinced the world that there really is a problem, there are what I call the pseudo-skeptics, a large group that is more widely known as ‘Lukewarmists’.
They include many professors who don’t disagree that the trace gas CO2 must be causing ‘some’ warming but think it is so small it isn’t worth worrying about.
This group also fully backs the greenhouse gas theory and claims CO2 warming is logarithmic (i.e., determined on a sliding scale of positive water vapor feedback – see this post from WUWT with reader comments and the subsequent confusion).
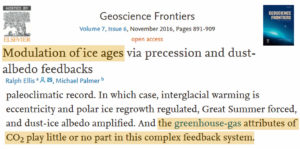
Assessing human impacts on climate and biodiversity requires an understanding of the relationship between the concentration of carbon dioxide (CO2) in the Earth’s atmosphere and global temperature (T). Here I explore this relationship empirically using comprehensive, recently-compiled databases of stable-isotope proxies from the Phanerozoic Eon (~540 to 0 years before the present) and through complementary modeling using the atmospheric absorption/transmittance code MODTRAN. Atmospheric CO2 concentration is correlated weakly but negatively with linearly-detrended T proxies over the last 425 million years.
According to the calculations of Dr. James Hansen, the radiative influence derived from the increase in CO2 during the last deglaciation was so negligible that it equated to “a third of energy required to power a honey bee in flight” (Ellis and Palmer, 2016).
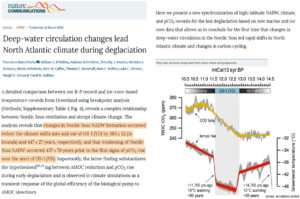
A new paper indicates the rise in CO2 concentration occurred well after the Northern Hemisphere’s ocean circulation changes drove the abrupt warming (~11,700 years ago) that ended the last ice age – a lag that effectively leaves no causal role for CO2 during deglaciation.
by P. Homewood, April 7, 2019 in NotaLotofPeopleKnowThat
ABSTRACT
It is thought that the Northern Hemisphere experienced only ephemeral glaciations from the Late Eocene to the Early Pliocene epochs (about 38 to 4 million years ago), and that the onset of extensive glaciations did not occur until about 3 million years ago. Several hypotheses have been proposed to explain this increase in Northern Hemisphere glaciation during the Late Pliocene. Here we use a fully coupled atmosphere-ocean general circulation model and an ice-sheet model to assess the impact of the proposed driving mechanisms for glaciation and the influence of orbital variations on the development of the Greenland ice sheet in particular. We find that Greenland glaciation is mainly controlled by a decrease in atmospheric carbon dioxide during the Late Pliocene. By contrast, our model results suggest that climatic shifts associated with the tectonically driven closure of the Panama seaway, with the termination of a permanent El Niño state or with tectonic uplift are not large enough to contribute significantly to the growth of the Greenland ice sheet; moreover, we find that none of these processes acted as a priming mechanism for glacial inception triggered by variations in the Earth’s orbit.
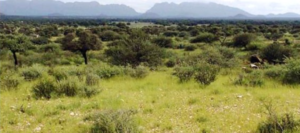
Real vegetation development in southern Africa takes a very different course than claimed by climate models
By Die kalte Sonne
(German translated by P Gosselin)
Climate models provide answers to all conceivable questions about the future. Political decision-makers are grateful for this information because they can make their plans accordingly.
But are the forecasts derived from models correct at all?
A research team led by Timm Hoffman has now compared the model projections with real vegetation development in southern Africa using historical photos. The sobering result: Nature has mostly developed quite differently than assumed by the models. In contrast to the model assumptions, no significant long-term trend in precipitation could be observed. Vegetation belts, which were supposed to shrink, ended up expanding. Confidence in the models is correspondingly low.
Political planning or even CO2 damage calculations based on the simulations are not possible. Here is the abstract of the work published in the journal Anthropocene in March 2019:
…
Southern Africa vegetation expanding, images show. Source: here.
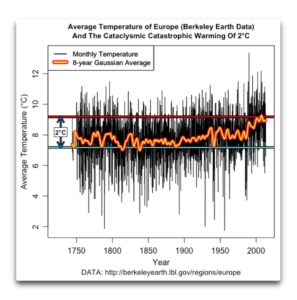
People often say that we’re heading into the unknown with regards to CO2 and the planet. They say we can’t know, for example, what a 2°C warming will do because we can’t do the experiment. This is seen as important because for unknown reasons, people have battened on to “2°C” as being the scary temperature rise that we’re told we have to avoid at all costs.
But actually, as it turns out, we have already done the experiment. Below I show the Berkeley Earth average surface temperature record for Europe. Europe is a good location to analyze, because some of the longest continuous temperature records are from Europe. In addition, there are a lot of stations in Europe that have been taking record for a long time. This gives us lots of good data.
So without further ado, here’s the record of the average European temperature.
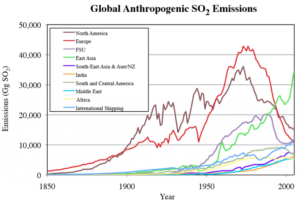
Anthropogenic emissions of SO2 into the troposphere peaked during year 1972 at about 131 Megatonnes. By year 2000, due to worldwide Clean Air Act efforts, SO2 emissions in the West had decreased by approximately 48 Megatonnes. However, during the same time period, emissions elsewhere rose by 23 Megatonnes, for a net worldwide decrease of 25 Megatonnes.
…
Figure 1: Global sulfur dioxide emissions by region (North Amer- ica = USA,Canada; East Asia, Japan, China, and South Korea). J.Smith et al., Fig 6.
…
It also proves that the IPCC “Graph of Radiative Forcings” is completely incorrect, since it does not include any warming due to the removal of dimming-aerosols from the atmosphere. To be correct, this forcing needs to be included (which will have the effect of completely eliminating any forcing due to CO2). As noted above, all of the warming can be accounted for by the reduction in SO2 emissions.
During the Mid-Holocene, when CO2 concentrations were stable and low (270 ppm), Antarctica’s massive Ross Ice Shelf naturally collapsed, adding the meltwater equivalent of 3-4 meters to sea levels.
Because CO2 concentrations changed very modestly during the pre-industrial Holocene (approximately ~25 ppm in 10,000 years), climate models that are predicated on the assumption that CO2 concentration changes drive ocean temperatures, ice sheet melt, and sea level rise necessarily simulate a very stable Holocene climate.
In contrast, changes in ocean temperatures, ice sheet melt, and sea level rise rates were far more abrupt and variable during the Holocene than during the last 100 years.
Modern ocean changes are barely detectable in the context of natural variability
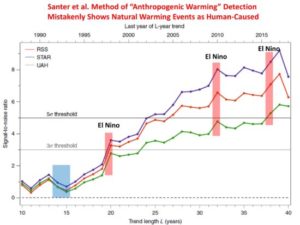
A new paper in Nature Climate Change by Santer et al. (paywalled) claims that the 40 year record of global tropospheric temperatures agrees with climate model simulations of anthropogenic global warming so well that there is less than a 1 in 3.5 million chance (5 sigma, one-tailed test) that the agreement between models and satellites is just by chance.
And, yes, that applies to our (UAH) dataset as well.
While it’s nice that the authors commemorate 40 years of satellite temperature monitoring method (which John Christy and I originally developed), I’m dismayed that this published result could feed a new “one in a million” meme that rivals the “97% of scientists agree” meme, which has been a very successful talking point for politicians, journalists, and liberal arts majors.
John Christy and I examined the study to see just what was done. I will give you the bottom line first, in case you don’t have time to wade through the details:
The new Santer et al. study merely shows that the satellite data have indeed detected warming (not saying how much) that the models can currently only explain with increasing CO2 (since they cannot yet reproduce natural climate variability on multi-decadal time scales).
That’s all.
But we already knew that, didn’t we? So why publish a paper that goes to such great lengths to demonstrate it with an absurdly exaggerated statistic such as 1 in 3.5 million (which corresponds to 99.99997% confidence)? I’ll leave that as a rhetorical question for you to ponder.
Until now, carbon dioxide has been dumped in oceans or buried underground. Industry has been reluctant to implement carbon dioxide scrubbers in facilities due to cost and footprint.
What if we could not only capture carbon dioxide, but convert it into something useful? S. Komar Kawatra and his students have tackled that challenge, and they’re having some success.
Thomas Crowther identifies long-disappeared forests available for restoration across the world. He will describe how there is room for an additional 1.2 trillion new trees around the world that could absorb more carbon than human emissions each year. Crowther also describes data from thousands of soil samples collected by local scientists that reveal the world’s Arctic and sub-Arctic regions store most of the world’s carbon. But the warming of these ecosystems is causing the release of this soil carbon, a process that could accelerate climate change by 17%. This research is revealing that the restoration of vegetation and soil carbon is by far our best weapon in the fight against climate change.
The living parts of the planet make it unique from all other parts of the solar system, and they drive every aspect of biogeochemical cycling. It is essential that we represent these living processes into our understanding of current and future biogeochemical cycles in order to understand and predict climate change.
by G. Geuskens, 14 février 2019, in ScienceClimatEnergie
Le climat peut changer, comme il l’a toujours fait et continuera à le faire sous l’action de variables naturelles. Les activités humaines peuvent-elles avoir une influence comme le prétend la théorie du réchauffement climatique d’origine anthropique ? Cette théorie est basée sur l’existence d’un hypothétique effet de serre défini comme un phénomène radiatifcausé par des gaz tels la vapeur d’eau ou le CO2 qui absorbent une fraction du rayonnement infrarouge émis par la Terre et le réémettent ensuite dans toutes les directions et notamment vers la surface terrestre dont la température serait, de ce fait, plus élevée qu’en l’absence de gaz absorbant l’infrarouge. L’effet de serre résulterait donc essentiellement de l’émission par les molécules de CO2 d’un rayonnement de fluorescence dans le domaine infrarouge [1]. Cette définition est claire et scientifiquement valable car conforme au principe de réfutabilité défini par Karl Popper. Nous l’examinerons à la lumière de théories physiques bien établies et de faits expérimentaux connus.
According to the IPCC at least 77%, but more probably 120%, and up to 200% of the observed warming, has been caused by GHGs.
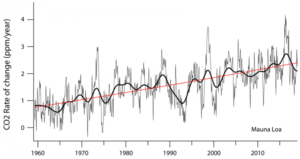
The rate of CO2 change (the atmospheric increase in CO2 every year) has been increasing almost linearly since 1959 and is currently ~2.4 ppm/year.
…
Figure 2. Mauna Loa rate of increase in CO2 (ppm/year). Thin line, 12-month increase. Thick line, gaussian smoothing. Red line, 2nd order polynomial least-squares fit to the yearly increase.
by Kevin Murphy in Judith Curry, January 28, 2019 in ClimateEtc.
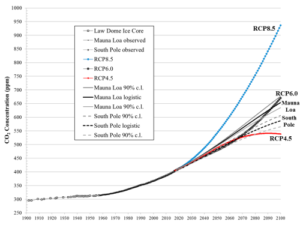
A response to: “Is RCP8.5 an impossible scenario?”. This post demonstrates that RCP8.5 is so highly improbable that it should be dismissed from consideration, and thereby draws into question the validity of RCP8.5-based assertions such as those made in the Fourth National Climate Assessment from the U.S. Global Change Research Program.
Analyses of future climate change since the IPCC’s 5th Assessment Report (AR5) have been based on representative concentration pathways (RCPs) that detail how a range of future climate forcings might evolve.
Several years ago, a set of RCPs were requested by the climate modeling research community to span the range of net forcing from 2.6 W/m2 to 8.5 W/m2 (in year 2100 relative to 1750) so that physics within the models could be fully exercised. Four of them were developed and designated as RCP2.6, RCP4.5, RCP6.0 and RCP8.5. They have been used in ongoing research and as the basis for impact analyses and future climate projections.
…
Figure 2. History and forecasts of CO2 concentration. RCP8.5 is defined by 936 ppm in 2100.
by Jean, N. 25 janvier 2019 in ScienceClimatEnergie
En octobre 2017 un article signé Carl Brehmer[1] et traitant de la théorie de l’effet de serre radiatif était publié sur le site web de l’association anglaise Principia Scientific International[2]. Dans cet article, l’auteur utilisait des données fournies par les stations météorologiques SURFRAD et démontrait que la théorie de l’effet de serre ne pouvait pas expliquer les observations. Si l’auteur a raison, il s’agit encore d’un sérieux problème pour la théorie. Dans le présent article nous allons suivre les pas de Carl Brehmer mais nous allons faire nos propres calculs en employant une autre méthodologie. Arriverons-nous aux mêmes conclusions?
.
Figure 1. Les stations SURFRAD de la NOAA aux Etats-Unis
A very large majority of establishment academic climate scientists have succumbed to a virulent infectious disease – the CO2 Derangement Syndrome. Those afflicted by this syndrome present with a spectrum of symptoms .The first is an almost total inability to recognize the most obvious Millennial and 60 year emergent patterns which are trivially obvious in solar activity and global temperature data.
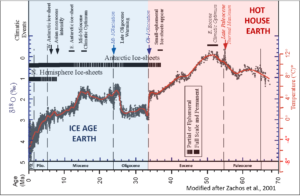
Note how the PETM (55 Ma) is about as far from a CO2 analog to modern times as it possibly could be… unless the PETM stomata data are correct, in which case AGW is even more insignificant than previously thought.
Regarding temperatures, the PETM is also about as far from being an analog to modern times as it possibly could be.
Figure 2. High latitude SST (°C) From benthic foram δ18O. Funny how the PETM is often cited as a nightmarish version of a real-world RCP8.5… While the warmer EECO is a climatic optimum. (Zachos et al., 2001). Note: Older is to the right.
Recently, CO2 Science brought up a paper in Nature Communications.
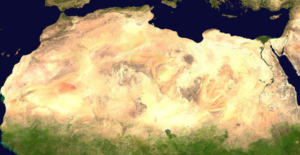
Using satellite images, Venter et al. 2018 found an eight percent increase in woody vegetation in sub-Saharan Africa over the last three decades, underscoring the global “greening trend”.
…
According to Wikipedia, the Sahara covers a vast area of some 9.2 million square kilometers. Eight percent of that translates into more than 700,000 square kilometers. That’s an area that’s almost as big as Germany and France combined! This is profound.
In other words, it’s well over 10,000 Manhattans!
Recent study by Venter et al finds that the Sahara has shrunk by 8% over the past three decades. NASA image, public domain.
by Dr. Jean N., 16 janvier 2019 in ScienceClimatEnergie
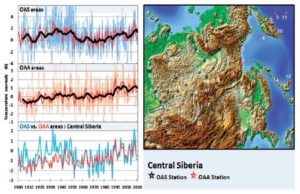
La théorie radiative de l’effet de serre prédit que la température de la basse atmosphère augmente lorsque le taux de CO2 croît. Si l’on prend par exemple une très vaste région, comme la Chine centrale ou le Midwest américain, qui couvrent tous deux des centaines de milliers de km2, on devrait donc observer un accroissement des températures moyennes de la basse atmosphère en fonction du temps. Effectivement, dans ces régions, et comme pour tout l’hémisphère Nord, le taux de CO2 n’a fait qu’augmenter depuis le début des mesures par spectrométrie infra-rouge en 1959. Cependant, une étude récente vient de montrer que la température moyenne n’aurait pas augmenté dans ces vastes régions, et ce malgré l’augmentation du taux de CO2 atmosphérique. L’étude en question a été publiée dans Energy & Environment en 2018 par deux chercheurs danois de la Danish Technical University, Frank Lansner et Jens Pedersen. Il faut rester prudent, mais si cette étude est confirmée, il s’agirait d’un sérieux problème pour la théorie radiative de l’effet de serre.
…
Figure 1. Anomalie de température pour la Sibérie centrale entre 1900 et 2010 (voir article)
Study suggests that in the last 60 years up to half the observed warming and associated sea level rise in low- and mid- latitudes of the Atlantic Ocean is due to changes in ocean circulation.
Over the past century, increased greenhouse gas emissions have given rise to an excess of energy in the Earth system. More than 90% of this excess energy has been absorbed by the ocean, leading to increased ocean temperatures and associated sea level rise, while moderating surface warming.
The multi-disciplinary team of scientists have published estimates in PNAS, that global warming of the oceans of 436 x 1021 Joules has occurred from 1871 to present (roughly 1000 times annual worldwide human primary energy consumption) and that comparable warming happened over the periods 1920-1945 and 1990-2015.
Climate models postulate that increasing CO2 concentrations will intensify the Earth’s water cycle. This intensification is believed to eventually result in dangerous (3°C and up) global warming. Observational evidence has thus far falsified these IPCC-endorsed claims.
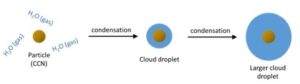
Comme tout le monde le sait, pour expliquer la légère hausse des températures de l’atmosphère observée au 20e siècle, le GIEC invoque un seul responsable : le taux de CO2 atmosphérique, et donc l’activité humaine. Les médias, bien entendu, suivent le GIEC et le monde entier diabolise le CO2. Cependant, n’existe-t-il pas d’autres hypothèses? Les lecteurs attentifs de ce site (SCE) savent que l’hypothèse du GIEC est mise à mal par toute une série d’observations (voir par exemple ici, ici et ici) et que certains problèmes théoriques existent dans la théorie même de l’effet de serre (voir ici et ici). Quelle est donc l’explication pour le réchauffement si ce n’est pas le taux de CO2? Bien qu’il y ait probablement des causes multiples, nous allons voir qu’une équipe de chercheurs du CERN propose une hypothèse alternative en se basant sur les résultats du projet CLOUD. Une vidéo récente (octobre 2018) présentant les résultats de cette expérience sera d’ailleurs présentée en fin d’article. Avant de regarder cette vidéo, faisons d’abord le point.
Figure 1. Formation de nuages en présence de noyaux de condensation (CCN : Cloud Condensation Nuclei).
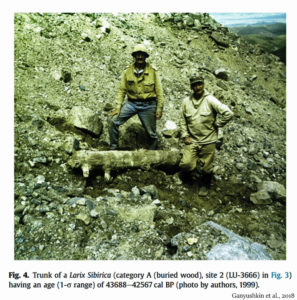
Between 60 and 40 thousand years ago, during the middle of the last glacial, atmospheric CO2 levels hovered around 200 ppm – half of today’s concentration.
Tree remains dated to this period have been discovered 600-700 meters atop the modern treeline in the Russian Altai mountains. This suggests surface air temperatures were between 2°C and 3°C warmer than today during this glacial period.
Tree trunks dating to the Early Holocene (between 10.6 and 6.2 thousand years ago) have been found about 350 meters higher than the modern treeline edge. This suggests summer temperatures were between 2°C and 2.5°C warmer than today during the Early Holocene, when CO2 concentrations ranged between about 250 and 270 ppm.
None of this paleoclimate treeline or temperature evidence correlates with a CO2-driven climate.
More people are finally beginning to realize that supplying the world with sufficient, stable energy solely from sun and wind power will be impossible.
Germany took on that challenge, to show the world how to build a society based entirely on “green, renewable” energy. It has now hit a brick wall. Despite huge investments in wind, solar and biofuel energy production capacity, Germany has not reduced CO2 emissions over the last ten years. However, during the same period, its electricity prices have risen dramatically, significantly impacting factories, employment and poor families.
Germany has installed solar and wind power to such an extent that it should theoretically be able to satisfy the power requirement on any day that provides sufficient sunshine and wind. However, since sun and wind are often lacking – in Germany even more so than in other countries like Italy or Greece – the country only manages to produce around 27% of its annual electric power needs from these sources.
…
La géologie, une science plus que passionnante … et diverse