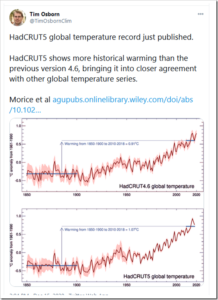
Our friends at the CO2 Coalition have published another excellent report.
This white paper by Richard Lindzen and John Christy explores the global mean temperature anomaly record. Their focus isn’t on whether it’s right or wrong; it’s on its significance relative to natural variability and its inherently low signal-to-noise ratio. Here’s the executive summary:
STUDIES AND RESOURCES, WHITE PAPERS AND OTHER PUBLICATIONS
4 DEC, 2020
The Global Mean Temperature Anomaly Record
How it works and why it is misleading
by Richard S. Lindzen and John R. Christy
The CO2 Coalition is honored to present this Climate Issues in Depth paper by two of America’s most respected and prolific atmospheric physicists, MIT professor emeritus Richard Lindzen, who is a longtime member of the Coalition, and University of Alabama in Huntsville professor John Christy.
Professor Lindzen has published over 200 scientific articles and books over a five-decade career. He has held professorships at the University of Chicago, Harvard University and MIT. He is a fellow and award recipient of the American Meteorological Society and the American Geophysical Union. He is also a member of the National Academy of Science and was a lead author of the UN IPCC’s third assessment report’s scientific volume. His research has highlighted the scientific uncertainties about the impact of carbon dioxide emissions on temperature and climate more generally.
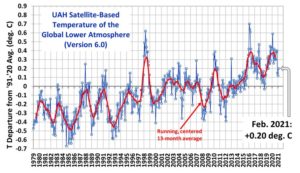
Professor Christy, the director of the Earth System Science Center at The University of Alabama in Huntsville, began studying global climate issues in 1987. He has been Alabama’s State Climatologist since 2000 and a fellow of the American Meteorological Society since 2002. He and CO2 Coalition member Dr. Roy W. Spencer developed and have maintained one of the key global temperature data sets relied on by scientists and government bodies, using microwave data observed in the troposphere from satellites since 1979. For this achievement, they were awarded NASA’s Medal for Exceptional Scientific Achievement.
The purpose of this paper is to explain how the data set that is referred to by policy-makers and the media as the global surface temperature record is actually obtained, and where it fits into the popular narrative associated with climate alarm.
Executive Summary
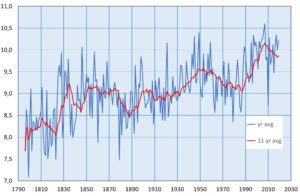
At the center of most discussions of global warming is the record of the global mean surface temperature anomaly—often somewhat misleadingly referred to as the global mean temperature record. This paper addresses two aspects of this record. First, we note that this record is only one link in a fairly long chain of inference leading to the claimed need for worldwide reduction in CO2 emissions. Second, we explore the implications of the way the record is constructed and presented, and show why the record is misleading.
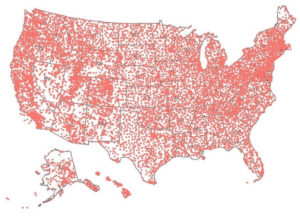
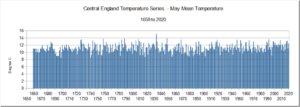
This is because the record is often treated as a kind of single, direct instrumental measurement. However, as the late Stan Grotch of the Laurence Livermore Laboratory pointed out 30 years ago, it is really the average of widely scattered station data, where the actual data points are almost evenly spread between large positive and negative values.
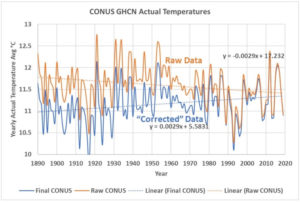
The average is simply the small difference of these positive and negative excursions, with the usual problem associated with small differences of large numbers: at least thus far, the one-degree Celsius increase in the global mean since 1900 is swamped by the normal variations at individual stations, and so bears little relation to what is actually going on at a particular one.