Archives par mot-clé : 2019

UK State Of The Climate Report 2019

by P. Homewood, April 16, 2020 In NotaLotofPeopleKnowThat


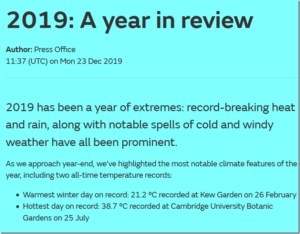
London, 16 April: The floods that affected northern England in the autumn of 2019 were nothing out of the ordinary. That’s according to a new review of the UK’s 2019 weather.

Author Paul Homewood says that although rainfall in the region was high, it has been exceeded several times in the past, right back to the 19th century.

Key findings

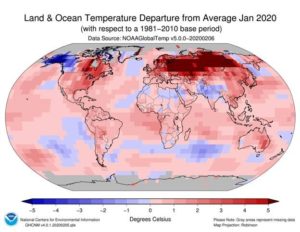
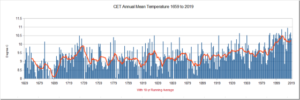
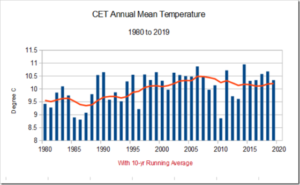
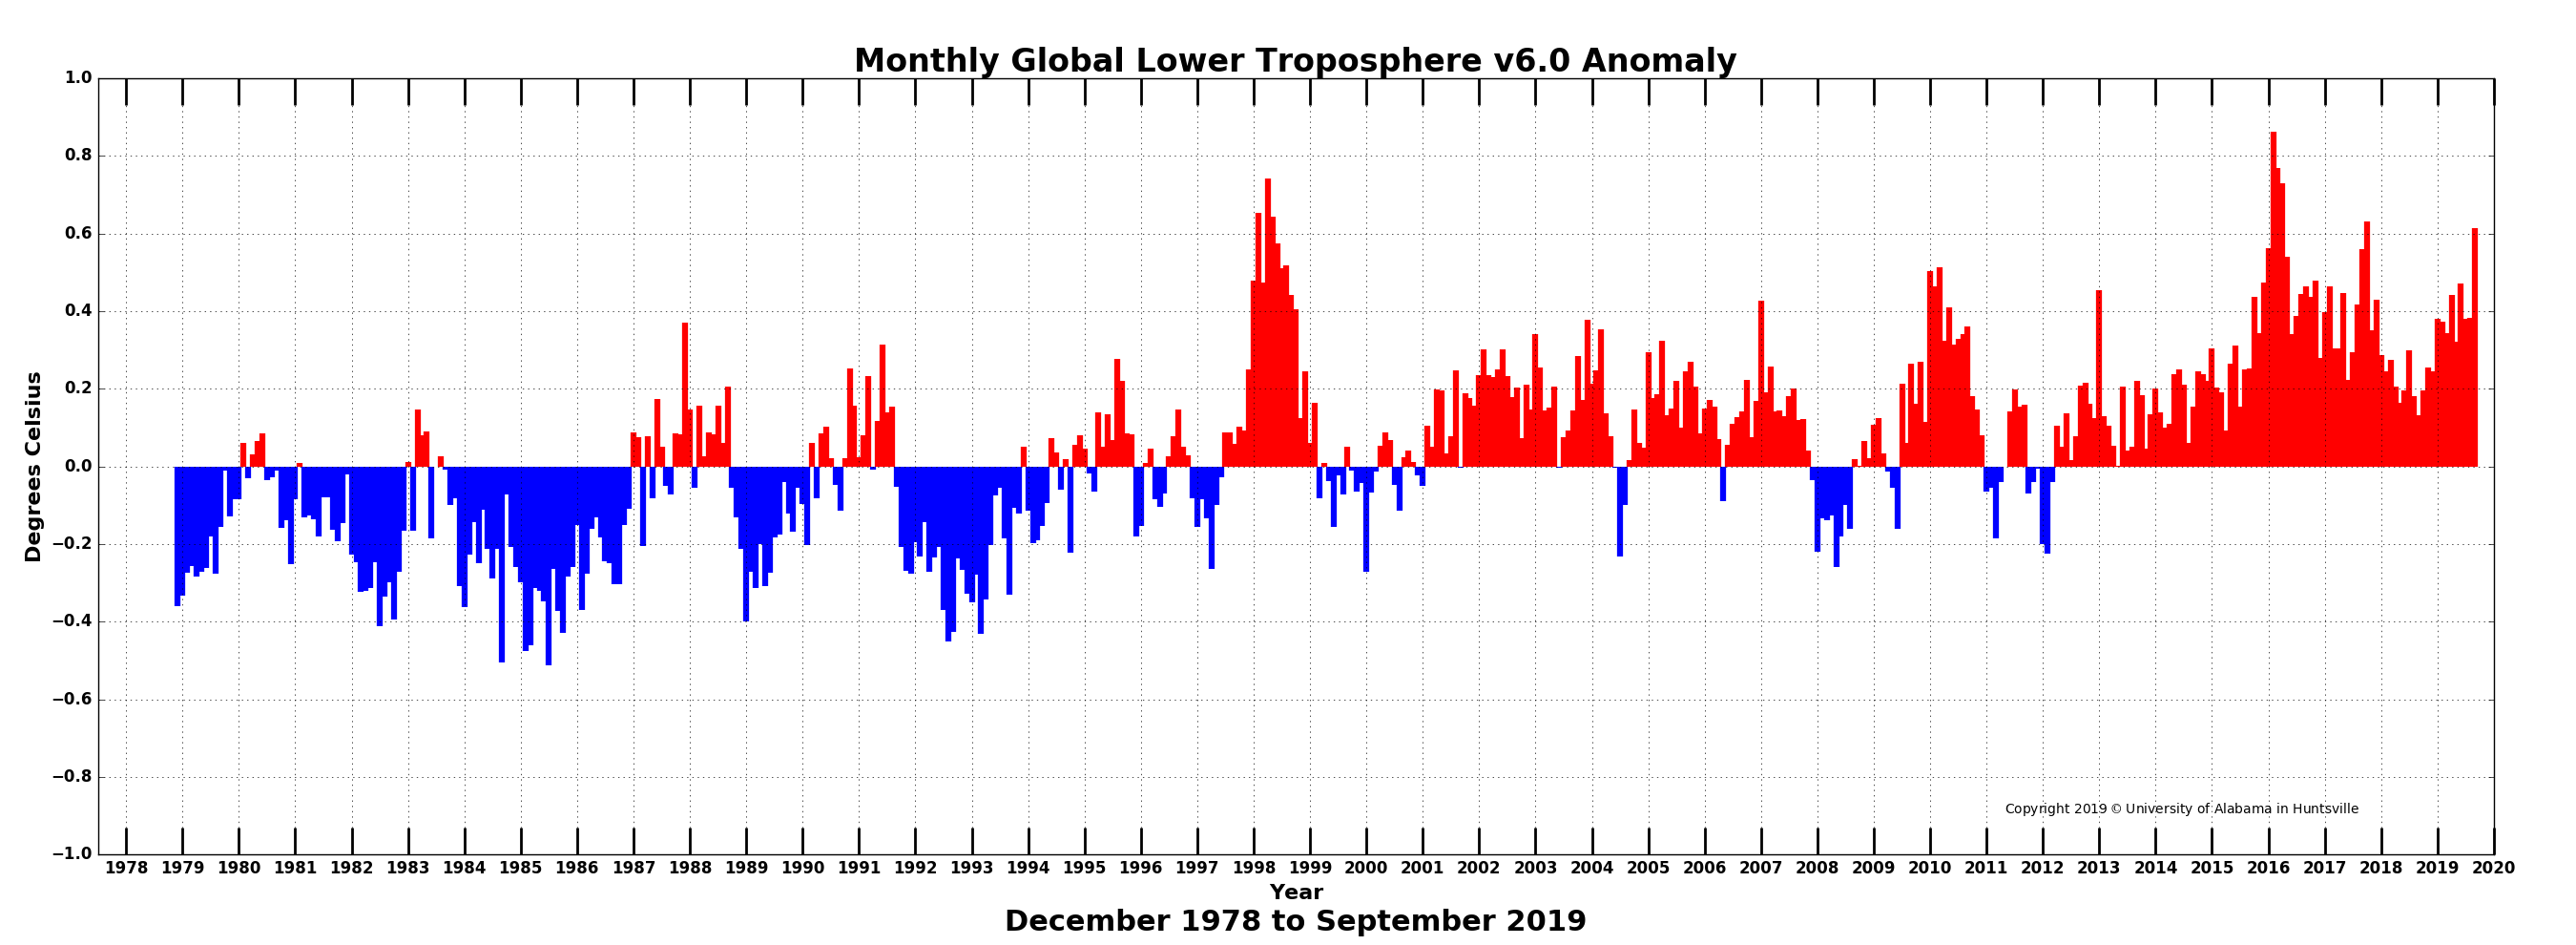
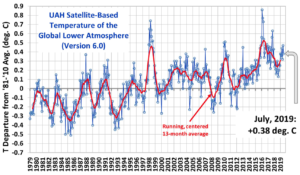
* After a rising trend between the 1980s and early 2000s, temperature trends have stabilised in the UK.

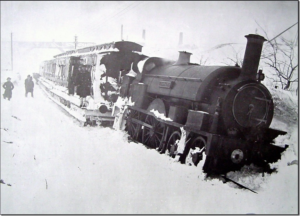
* Heatwaves are not becoming more intense, but extremely cold weather has become much less common.

* There is little in the way of long-term trends in rainfall in England and Wales.

* Sea-level rise around British coasts is not accelerating.

The UK’s Weather in 2019: More of the same, again (PDF)

Met Office Does Not Know What “Extreme Weather” Is.

by P. Homewood, March 9, 2020 in NotaLotofPeopleKnowThat


https://www.metoffice.gov.uk/about-us/press-office/news/weather-and-climate/2019/weather-overview-2019

According to the Met Office, 2019 was a year of weather extremes in the UK. There is actually very little evidence to back this claim up, but this does not stop them ludicrously claiming one mild day in February as “extreme”!

To most people, extreme weather would be the sort of stuff our ancestors experienced in this very week in 1891:

NOAA Relies on ‘Russian Collusion’ to Claim January Was Hottest Month on Record

by Anthony Watts, February 29, 2020 in WUWT


In a report generating substantial media attention this month, the National Oceanic and Atmospheric Administration (NOAA) claimed January 2020 was the hottest January on record. In reality, the claim relies on substantial speculation, dubious reporting methods, and a large, very suspicious, extremely warm reported heat patch covering most of Russia.

The January 2020 Climate Assessment Report, released by NOAA’s National Center for Environmental Information (NCEI), was accompanied by a map showing a giant red menace of extraordinary asserted warmth extending from the Russian border with Poland well into Siberia. Yet, the asserted hot spot appears nowhere else.


Figure 1: Map of temperature departure provided by NOAA/NCEII. Note the huge red spot over Russia.

Continuer la lecture de NOAA Relies on ‘Russian Collusion’ to Claim January Was Hottest Month on Record

RETOUR SUR 2019

by Samuel Furfari, 21 février 2020, in ScienceClimatEnergie


L’année 2019 aurait été celle de l’hystérie climatique. Les manifestations des jeunes qui ont suivi avec enthousiasme les conseils d’une jeune suédoise ont donné à des politiciens en quête de raison d’être une opportunité pour montrer qu’ils s’occupent de la jeunesse, mais aussi de l’environnement ou plus précisément de « sauver la Planète ».
Qui n’est pas en faveur de la protection de l’environnement ?
Qui n’est pas attentif à la santé ?
L’occasion rêvée pour redonner du sens à la politique était trop belle, d’autant plus qu’il y avait en 2019 l’élection d’un nouveau parlement européen. L’inflation de promesses inconsidérées ne s’est pas fait attendre. Elle a abouti le 11 décembre 2019 à la publication d’une nouvelle stratégie de la Commission européenne appelée « Green Deal » et à son adoption par le Conseil européen le 13 décembre, avec un parlement européen qui en veut encore plus.

L’inflation des promesses est à son comble, tout comme le budget qu’il va falloir débourser pour atteindre ces promesses, destinées en fait à redonner une raison d’être à une Union européenne en manque de projets enthousiasmants pour ses citoyens et ignorée par les pays qui dirigent  les grands enjeux géopolitiques comme l’a manifestement montré le camouflet infligé à Angel Merkel lors de la conférence sur la Libye à  Berlin le 21 janvier 2020 .

Pourtant, sur le front de l’énergie, et non des politiques énergétiques, le début de la révolution annoncée n’a même pas commencé. Au contraire, la toute-puissance des énergies fossiles a été confirmée voire renforcée. La nouvelle géopolitique de l’énergie, qui a été créée grâce à l’abondance des énergies fossiles, s’est affermie et est entérinée par une grande partie du business de l’ énergie.

Bad news for climate alarmists: global carbon dioxide emissions flatlined in 2019

by A. Watts, February 13, 2020 in WUWT


From the inconvenient data department and the IEA comes this press release.


Despite widespread expectations of another increase, global energy-related carbon dioxide emissions stopped growing in 2019, according to IEA data released today.

After two years of growth, global emissions were unchanged at 33 gigatonnes in 2019 even as the world economy expanded by 2.9%. This was primarily due to declining emissions from electricity generation in advanced economies, thanks to the expanding role of renewable sources (mainly wind and solar), fuel switching from coal to natural gas, and higher nuclear power generation. Other factors included milder weather in several countries, and slower economic growth in some emerging markets.

Continuer la lecture de Bad news for climate alarmists: global carbon dioxide emissions flatlined in 2019

Global Fossil Fuel Emissions Up 0.6% In 2019

by P. Homewood, February 6, 2020 in NotaLotofPeopleKnowThat


Emissions from fossil fuel and industry (FF&I) are expected to reach 36.81bn tonnes of CO2 (GtCO2) in 2019, up by only 0.24GtCO2 (0.6%) from 2018 levels, according to the latest estimates from the Global Carbon Project (GCP).

The data is being published in Earth System Science Data Discussions, Environmental Research Letters and Nature Climate Change to coincide with the UN’s COP25 climate summit in Madrid, Spain.

The growth of global emissions in 2019 was almost entirely due to China, which increased its CO2 output by 0.26GtCO2. The rest of the world actually reduced its emissions by -0.02GtCO2, thanks to falling coal use in the US and Europe, as well as much more modest increases in India and the rest of the world, compared to previous years.

The GCP researchers say that “a further rise in emissions in 2020 is likely” as global consumption of natural gas is “surging”, oil use continues to increase and, overall, energy demand rises.

Despite the rapid rise and falling costs of renewables in many parts of the world, the majority of increases in energy demand continue to be met by fossil fuels. For example, gas met around two-fifths of the increase in demand in 2018, against just a quarter coming from renewables.

Overall, human-caused CO2 emissions, including those from FF&I and land use, are projected to increase by 1.3% in 2019. This is driven by a 0.29GtCO2 (5%) increase in land-use emissions – including deforestation –  which is the fastest rate in five years. While land use only represents around 14% of total 2019 emissions, it will contribute more than half the increase in emissions in 2019.

While more modest than in recent years, the increase in emissions in 2019 puts the world even further away from meeting its climate change goals under the Paris Agreement.

China Thermal Power Up 2.4% Last Year

by P. Homewood, January 28, 2020 in NotaLotofPeopleKnowThat


Provisional figures from the China Energy Portal indicate that thermal generation continues to rise in China, albeit at a slower rate then the last few years

https://chinaenergyportal.org/en/2019-electricity-other-energy-statistics-preliminary/

As I noted in November, there are three factors behind the slower rise in thermal (which is almost certainly predominantly coal-fired):

  • Overall demand for electricity has increased at a much slower rate in 2019 – 4.7% against 8.4% in 2019. This reflects the dramatic slowdown in Chinese economic growth.
  • New nuclear capacity has been added in the last two years.
  • Better hydro generation, presumably due to wetter weather.

Significantly, thermal generating capacity has continued to grow in 2019, by 4.1%. Just as significant is the dramatic slowdown in new solar power capacity being added. In 2018, 45GW was added, but this dropped to 26GW last year, following the restriction of subsidies.

New wind capacity increased marginally in 2019, from 21GW in 2018 to 25GW.

Also  China’s Coal Power To Remain Dominant Till At Least 2035

2019 Science Refutes Climate Alarm On Every Front… Shrinking Deserts, Growing Islands, Crumbling Consensus, Weaker Storms, Cooler Arctic Etc. Etc. Etc.

by P. Gosselin, December 31, 2019 in NoTricksZone


2019 science: Absolutely no climate alarm 

No alarm on every aspect: stable polar ice, normal sea level rise, no consensus, growing snow cover, less tropical storms, tornadoes, shrinking deserts, global greening, predictions wrong, models flawed, climate driven by sun, ocean cycles, biodiversity, warmer 1000 years ago…etc…


2019 saw a great amount of new science emerge showing that there’s nothing alarming or catastrophic about our climate. 

Some 2019 scientific findings

Need to make a presentation showing there is no climate alarm? The following findings we reported on in 2019 will put many concerns to rest.

Hundreds of peer-reviewed papers ignored by media

What follows are some selected top science-based posts we published here at NoTricksZone in 2019. These new findings show there is absolutely no climate alarm.

Hundreds of new peer-reviewed papers, charts, findings, etc – which the IPCC, activists and media ignore and even conceal. No wonder they’ve gotten so shrill.


An Exceptional Year? Hardly, Mr McCarthy

by P. Homewood, January 1, 2020 in NotaLotofPeopleKnowThat


The year as a whole has been remarkably unremarkable, as far as temperatures are concerned, ranking only the 24th warmest on record since 1659, and not as warm as even 1733, 1779, 1834 and 1868:


https://www.metoffice.gov.uk/hadobs/hadcet/cet_info_mean.html

A closer look at the years since 1980 confirms that the 10-year average has been falling since 2006:

2019 Science Refutes Climate Alarm On Every Front… Shrinking Deserts, Growing Islands, Crumbling Consensus, Weaker Storms, Cooler Arctic Etc. Etc. Etc.

by P. Gosselin, December 31, 2019 in NoTricksZone


2019 science: Absolutely no climate alarm 

No alarm on every aspect: stable polar ice, normal sea level rise, no consensus, growing snow cover, less tropical storms, tornadoes, shrinking deserts, global greening, predictions wrong, models flawed, climate driven by sun, ocean cycles, biodiversity, warmer 1000 years ago…etc…

2019 saw a great amount of new science emerge showing that there’s nothing alarming or catastrophic about our climate. 

Some 2019 scientific findings

Need to make a presentation showing there is no climate alarm? The following findings we reported on in 2019 will put many concerns to rest.

Hundreds of peer-reviewed papers ignored by media

What follows are some selected top science-based posts we published here at NoTricksZone in 2019. These new findings show there is absolutely no climate alarm.

Hundreds of new peer-reviewed papers, charts, findings, etc – which the IPCC, activists and media ignore and even conceal. No wonder they’ve gotten so shrill.

January 2019

….

2019: The End Of A Decade When Climate Alarmism Tipped Into ‘Climate Crisis’

by J. Jessop, December 30, 2019 in ClimateChangeDispatch


In the final days of 2019, there is much to reflect upon events of the past year and, with the closing of the second decade of the 21st century, much to reflect upon how climate change alarmism has itself alarmingly morphed into something much more dangerous, visceral, urgent, ideologically driven and immediate as regards public perception and societal impact.

A decade during which global warming faded into obscurity (on account of the fact that there wasn’t any from 1998-2013) to be replaced almost universally by the more politically correct term of ‘climate change’, which has itself now been largely displaced in activist circles and the media by the terms ‘climate emergency’ and ‘climate crisis’.

Ironically so, because, bereft of an actual climate crisis, alarmist scientists and activists have proceeded to invent one, linguistically, as in the case of the Guardian’s newly introduced style guide and by co-opting extreme weather events and their impacts into the general narrative.

Judith Curry has written an excellent push back article to the lukewarm attempt by Wallace-Wells, among others, to dial down the alarmist hype in the light of the RCP8.5 criticisms, whilst still maintaining the necessary ‘scary’ projections of future warming.

Another year, and still no increase in severe U.S. tornadoes

by P. Homewood, December 27, 2019 in WUWT


Climate scientists love to blame every bad weather event on global warming. Yet we never hear them cite climate change for the relative absence of bad weather!

One such example are tornadoes in the US, where we now have several decades of carefully collated data.

With the year near an end, we know that the number of tornadoes has been above average this year, though well below 2008 and 2011. Primarily this is due to several outbreaks in February and April:

https://www.spc.noaa.gov/wcm/#data

The 2019 Atlantic Hurricane Season

by P. Homewood, December 11, 2019 in NotaLotofPeopleKnowThat


The Atlantic hurricane season has now officially ended, so let’s check the numbers.

https://www.aoml.noaa.gov/hrd/tcfaq/E11.html

http://rammb.cira.colostate.edu/products/tc_realtime/season.asp?storm_season=2019

There have been six hurricanes in total, including three major ones, Dorian, Humberto and Lorenzo. Coincidentally both numbers are the same as the average since 1950.

According to NOAA’s Hurricane Research Division, many hurricanes were missed in the earlier decades. Systematic aircraft reconnaissance began in 1944, but this only covered half of the Atlantic basin, until daily satellite monitoring started in 1966.

2019 the Third Least-Chilly in the Satellite Temperature Record

by Roy Spencer, December 6, 2019 in WUWT


It’s that time of year again, when we are subjected to exaggerated climate claims such as in this Forbes article, 2019 Wraps Up The Hottest Decade In Recorded Human History. Given that the global average surface temperature is about 60 deg. F, and most of the climate protesters we see in the news are wearing more clothing than the average Key West bar patron, I would think that journalists striving for accuracy would use a more accurate term than “hottest”.

So, I am announcing that in our 41-year record of global satellite measurements of the lower atmosphere, 2019 will come in as 3rd least-chilly.

For the decade 2010-2019, the satellite temperatures averaged only 0.15 C higher than in the previous decade (1990-1999). That’s less than a third of a degree F, which no one would even notice over 10 years.

If you are wondering how your neck of the woods has fared this year, the latest year-to-date plot of 2019 temperature departures from the 30-year average (1981-2010) shows the usual pattern of above- and below-normal, with little visual indication that the global average for 2019 is now running 0.36 deg. C above normal.

ORANGE ‘HEAVY SNOW’ ALERTS ISSUED ACROSS SPAIN

by Cap Allon, November 11, 2019 in Electroverse


Following Spain’s weekend of surprise early-season-snow, ORANGE ALERTS have now been issued across the country as the prospect of yet more severe wintry-weather looms — residents have been urged to prepare.

Spain’s state weather agency AEMET had predicted last weekend’s “polar front” and subsequently placed parts of Mallorca and Menorca on orange alert. Now though, an additional 33 provinces have been placed under winter-weather alerts across the country -from Lugo in the north, to Malaga in the south- as further Arctic plunges appear set to engulf ALL of Western/Southwestern Europe this week.

A staggering 40 cm (15.8 inches) of snow buried Northern Spain’s ski resorts over the weekend, including Fuentes de Invierno, in Asturias — as reported by murciatoday.com.

Snow also fell in more unexpected areas, like Port de Pollenca a small town in Northern Majorca.

https://globalcryospherewatch.org

UK ON COURSE FOR AN HISTORICALLY COLD NOVEMBER

by Cap Allon, November 19, 2019 in Electroverse


After decades of being lectured by the Met Office -among others– that global warming will bring an end to extreme-cold temperatures, the UK still somehow keeps-on clocking them — yet another example of how simple real-world observations can unravel the AGW-ruse.

Brits have been suffering-through an historically cold month, too — November’s average temperature has held well-below the norm for the first 17 days, continuing October’s dramatic cooling trend:

The Central England Temperature (CET) record measures the monthly mean surface air temperatures for the Midlands region of England, and is the longest series of monthly temperature observations in existence anywhere in the world.

Its mean reading for November 2019 (to the 17th) is sitting at 6.6C — that’s 0.7C below the already cool 1961-1990 average, the current standard period of reference for climatological data used by the WMO.

In the 360 years of CET data, there have only been 10 other years with an November average temperature of 6.6C — these are 1804, 1833, 1835, 1849, 1886, 1932, 1941, 1949, 1977, 1980.

Note also how the majority of these years fall in or around solar minimums of the past (1804, 1849, and 1980 being the only exceptions).

N. Hemisphere In Hypothermia! Widespread Early Winter…”Historic Snowstorms”…”Record Books Rewritten”

by P. Gosselin, November 13, 2019 in NoTricksZone


Winter has not even officially arrived, but already large areas of the northern hemisphere are seeing “historic snowfalls”, frigid temperatures and even avalanche alarms.

The Northern Hemisphere has certainly caught a major cold, one certainly not caused by the human CO2 virus. Instead of fever, parts of the northern hemisphere are in hypothermia!

Alarmists, media desperate

Though global warming scientists will never admit it, they are really surprised and stunned. All that is left for them is to make up some cockamamie warming-causes-cold explanations and hope there are enough severely stupid among the media and masses to believe it.

“United States — Rewrite the Record Books”

Beginning in North America, “sub-zero temperatures are now blasting” millions of Americans following “the three historic snowstorms which buried parts of the U.S. last month,” reports weather site electroverse.net here.

Electroverse writes that “lows throughout the week will be more like January temperatures” with readings below zero for many U.S. states and “temps down into the teens are even forecast as far south as Texas.” Yesterday, 97 records toppled.

“It’s a big deal,” Electroverse writes in its headline.

Solar activity suspected

It’s not the sort of thing we are supposed to be expecting from a “warming planet”.  Some climate experts blame natural factors, like solar activity, for the cold, and that these warnings have long been known since the sun has entered a new period of calm.

Freeze watches and warnings also extend as far south as Florida. And it’s only early November. And don’t expect to see many FFF activists to show up at rallies protesting hot weather any time soon.

Polar Bear Science site here also reports that the Hudson Bay in Canada has started freezing up earlier than normal three years in a row!

Europe starting to get clobbered by snow, 2m in Alps

Meanwhile cold has also spread across Europe, though not quite as brutal as what we’ve been seeing across North America.

NEW ZEALAND EXPERIENCES FOURTH COLDEST SEPTEMBER THIS CENTURY

by Cap Allon, October 4, 2019 in Electroverse


New Zealand’s average temperature last month –for the country as a whole– was below the 1981-2010 September avg., Niwa has said in its Monthly Climate Summary.

An unusual warming of the atmosphere high above Antarctica –called a Sudden Stratospheric Warming event (SSW)– assisted in making last month the fourth coldest September in New Zealand this century.

There have only ever been two SSWs recorded in the Southern Hemisphere, previous to this years — one in September 2002 (major) and another in September 2010 (minor).

The 2002 SSW event resulted in New Zealand experiencing a significant cold outbreak in October while the 2010 event was associated with record rainfall during September.

Record Antarctic Stratospheric Warming Causes Sept. 2019 Global Temperature Update Confusion

by Roy Spencer, October 4, 2019 in WUWT


While the vast majority of our monthly global temperature updates are pretty routine, September 2019 is proving to be a unique exception. The bottom line is that there is nothing wrong with the UAH temperatures we originally reported. But what I discovered about last month is pretty unusual.

It all started when our global lower tropospheric (LT) temperature came in at an unexpectedly high +0.61 deg. C above the 1981-2010 average. I say “unexpected” because, as WeatherBell’s Joe Bastardi has pointed out, the global average surface temperature from NOAA’s CFS model had been running about 0.3 C above normal, and our numbers are usually not that different from that model product.

[By way of review, the three basic layers we compute average temperatures from the satellites are, in increasing altitude, the mid-troposphere (MT), tropopause region (TP), and lower stratosphere (LS). From these three deep layer temperatures, we compute the lower tropospheric (LT) product using a linear combination of the three main channels, LT = 1.548MT – 0.538TP +0.01LS.]

Yesterday, John Christy noticed that the Southern Hemisphere was unusually warm in our lower stratosphere (LS) temperature product, while the Northern Hemisphere was unusually cool. This led me to look at the tropical results for our mid-troposphere (MT) and ‘tropopause’ (TP) products, which in the tropics usually track each other. A scatterplot of them revealed September 2019 to be a clear outlier, that is, the TP temperature anomaly was too cool for the MT temperature anomaly.

So, John put a notice on his monthly global temperature update report, and I added a notice to the top of my monthly blog post, that we suspected maybe one of the two satellites we are currently using (NOAA-19 and Metop-B) had problems.

As it turns out, there were no problems with the data. Just an unusual regional weather event that produced an unusual global response.

RECORDS CONTINUE TO FALL ACROSS THE NW + MORE HISTORIC COLD SET TO ENGULF ALL OF NORTH AMERICA BY OCT 10

by Cap Allon, October 3, 2019 in Electroverse


This weekend will mark the final phase of a major winter storm that ravaged the NW U.S. bringing whipping winds to the Flathead Valley, feet of snow along the Continental Divide and record-breaking/challenging temps for all.

A new all-time daily record low temperature was set in Kalispell, Montana on Wednesday, October 02 as the mercury plunged into the teens across the region.

The weather station at Glacier Park International Airport recorded a low of 19F (-7.2C) at 5 AM which busted the dates previous record low of 21F (-6.1C) set back in 1999.

Great Falls, Montana registered a record-smashing 9F (-12.8C) on Tue, Oct 01, according to the NWS, which annihilated the previous daily low of 22F (-5.6C) set back in 1959.

Additionally, areas to the northwest also saw record low daily temperatures on Tuesday as both Cut Bank and Browning comfortably surpassed their previous cold records from 1950.

And further south, crossing a few state lines into California, temperatures at Sacramento Executive Airport dropped to 42F (5.6C) early Wednesday morning, surpassing the old record of 43F (6.1C) set in 1971. Meaning that in less than a week, Sacramento has now set multiple all-time record lows; on Sunday, both downtown Sacramento and the airport set record lows of 45F (7.2C) and 46F (7.8C) respectively.

Global Temperature Report: September 2019

by Anthony Watts, October 3, 2019 in WUWT


Global climate trend since Dec. 1 1978: +0.13 C per decade

September Temperatures (preliminary)

Global composite temp.: +0.61 C (+1.10 °F) above seasonal average

Northern Hemisphere.: +0.64 C (+1.15 °F) above seasonal average

Southern Hemisphere.: +0.58 C (+1.00°F) above seasonal average

Tropics.: +0.60 C (+1.08°F) above seasonal average

August Temperatures (final)

Global composite temp.: +0.38 C (+0.68 °F) above seasonal average

Northern Hemisphere.: +0.33 C (+0.59 °F) above seasonal average

Southern Hemisphere.: +0.44 C (+0.79°F) above seasonal average

Tropics.: +0.45 C (+0.81 °F) above seasonal average

Notes on data released October 3, 2019 (v6.0)

September’s globally-averaged, bulk-layer atmospheric temperature anomaly of +0.61°C (+1.10°F) represented the warmest September reading of the past 41 Septembers in our satellite record. The jump from August was substantial (+0.23°C) and ranks among the largest month-to-month changes. (Several previous jumps were greater than 0.3°C however.) The warmth was global in extent with warmest September temperatures posted for both hemispheres and the tropical belt. This month-to-month heating is possibly related, at least in part, to the tropical Pacific Ocean’s loss of heat energy to the atmosphere in the recent months as El Niño conditions declined.

2019 Arctic Ice Demise Deferred Again

by Ron Clutz, October 2, 2019 in ScienceMatters


MASIE daily results for September show 2019 early melting followed by an early stabilizing and refreezing.

Note that 2019 started the month about 800k km2 below the 12 year average (2007 through 2018 inclusive).  There was little additional loss of ice, a rise then a dip below 4 M km2, and a sharp rise ending the month.  Interestingly, 2019 matched the lowest year 2012 at the start, but ended the month well ahead of both 2012 and 2007.

The table for day 273 shows distribution of ice across the regions making up the Arctic ocean.

Summer Heatwaves? It Was Hotter In 1707!!

by P. Homewood, Sept.2, 2019 in NotaLotofPeopleKnowThat


To read the headlines in the last month or two, you would think we had been having a Mediterranean summer.

The truth is much more mundane however.

The numbers for last month’s CET are now out. August ended up at 17.1C, meaning that there have been 32 Augusts as warm or warmer. Last month was no warmer than 1801, 1842 and 1932.

Summer as a whole ranked 48th hottest, tied with 1935.

The summer of 1976 still remains top of the list, but second hottest was way back in 1826.

Indeed there have been warmer summers on 28 occasions prior to 1900. Notably, one such summer was 1666, the 18th warmest. That was, of course, the year of the Great Fire of London, which swept through London between the 2nd and 6th of September.

Temps far, far below normal across almost the entire territory of European Russia

by Robert, August 4, 2019 in IceAgeNow


We’re talking about record-breaking cold across an area almost half as big as the entire contiguous United States.

2 Aug 2019 – In a number of points in the north-east of the territory, the temperature dropped to record lows. In the capital of the Komi Republic, in Syktyvkar, it dropped to 2.7 degrees, which is 0.3 degrees lower than the previous record held since 1944.

Not only in the northern areas, the temperature also dropped to critical levels. In Voronezh the thermometers showed +7 degrees, leaving behind the previous record of +7.1 degrees in 1971.

Further south, in Saratov, the minimum temperature on the first day of August was 9.6, beating the previous record of 10.4 degrees set in 1948.

The cold also hit Azov. In Tsimlyansk, Rostov Region, on August 1 the temperature fell to 13.3 degrees. The previous record, 13.6, was noted in 1975.

On the first day of August, the average temperature across almost the entire territory of European Russia was 4-6 degrees below normal, and in the Volga region it did not reach the average long-term values ​​of 8 degrees.

Cold weather throughout the territory from the White to the Black Sea will continue for at least another week.

European Russia covers nearly 4,000,000 km2 (1,500,000 sq mi).
Together, the 48 contiguous states and Washington, D.C. occupy a combined area of 8,080,464.3 km2 (3,119,884.69 sq miles).

http://www.hmn.ru/index.php?index=2&nn=62368

July 2019 Was Not the Warmest on Record

by Roy Spencer, August 2, 2019 in GlobalWarming


July 2019 was probably the 4th warmest of the last 41 years. Global “reanalysis” datasets need to start being used for monitoring of global surface temperatures. [NOTE: It turns out that the WMO, which announced July 2019 as a near-record, relies upon the ERA5 reanalysis which apparently departs substantially from the CFSv2 reanalysis, making my proposed reliance on only reanalysis data for surface temperature monitoring also subject to considerable uncertainty].


See also here