Presenting this week (Monday 9 April 2018) at the European Geosciences Union (EGU) meeting in Vienna, an international team, led by British Antarctic Survey, describes how analysis of 79 ice cores collected from across Antarctica reveals a 10% increase in snowfall over the last 200 years. This is equivalent to 272 giga tonnes of water – double the volume of the Dead Sea.
Lead author and ice core scientist Dr Liz Thomas from British Antarctic Survey explains: (…)
Canada’s stable-to-increasing polar bear population extends its range slightly further south of the 55th parallel (York et al., 2016).
According to published geological evidence from the 1950s, remnants of wine grape vineyards have been unearthed in regions as far north as the polar-bear-inhabiting 55th parallel during the Medieval Warm Period (~800s to 1300s AD).
By Dr. Sebastian Lüning and Prof. Fritz Vahrenholt
(German text translated by P Gosselin)
Newspapers like to write about heat and melt records in the Arctic, which supposedly had never happened before. That really sparks fear among the citizens. However an examination of the facts regularly brings amazing things to light, for example weather records from a German station on Spitzbergen during World War 2 for the period of 1944-1945.
In the journal International Journal of Climatology Rajmund Przybylak and his colleagues evaluated the data. Summary: Back then it was similarly warm as it is today
Little is known about the ice age human occupation of the Pacific Coast of Canada. Here we present the results of a targeted investigation of a late Pleistocene shoreline on Calvert Island, British Columbia. Drawing upon existing geomorphic information that sea level in the area was 2–3 m lower than present between 14,000 and 11,000 years ago, we began a systematic search for archaeological remains dating to this time period beneath intertidal beach sediments (…)
“Le contenu de la mémoire est fonction de la vitesse de l’oubli”
Désormais, chaque inondation quelque peu catastrophique, chaque tornade, chaque anomalie météorologique est rattachée au réchauffement climatique qui parait-il nous menace, mais dont en plus l’homme serait responsable !
Pourtant, la consultation de chroniques ou récits anciens est révélatrice de précédents tout aussi apocalyptiques, et relativise la notion même de “changements climatiques”, ainsi que la définition d’un “climat stable” qui n’a jamais existé mais qu’on voudrait instaurer à tout prix.
Well, folks were complaining that my graph of the CET compared to the centennial solar minima was just one location, England. So here are the five European temperature records which start before 1815. Now, if the theory of the solar/temperature connection is correct, the temperatures should start trending downward when the solar minima start, and they shouldn’t start warming back up until the sunspots get numerous again after the end of the minima. Here are the records so you can see if they agree with the theory.
(…) As you can see, there is no obvious sign that the solar minima have caused any change in the temperature. Some go up, some go down, some go nowhere.(…)
See also here Approaching ‘grand solar minimum’ could cause global cooling
Different sea level reconstructions show a spread in sea level rise over the last six decades and it is not yet certain whether the sum of contributors explains the reconstructed rise (…)
A synthesis of paleotemperature reconstructions from published case studies suggests warm onshore temperatures persisted across most of Afro-Arabia between 1000 and 1200 CE. (…)
1. During the first 2000 years of our 5000-year civilization, most of the time, the annual average temperature was 2ºC higher than now. The temperature in January was 3-5ºC higher than now.
2. From then on, there was a series of temperature fluctuations. The lowest temperatures occurred in AD 1000, 400, 1200, and 1700. The range of fluctuation was 1-2ºC.
3. In every 400-800 period, a smaller cycle lasting 50 to 100 years can be detected with a temperature range of 0.5 -1ºC.
4. During the above cycles, it seems that any coldest period started from the Pacific coast of East Asia. The cold waves then moved westward to Europe and the Atlantic coasts. And at the same time, there were also trends from the North to the South.
UPDATED: This opinion piece from Professor Henrik Svensmark was published September 9th in the Danish newspaper Jyllands-Posten. Originally the translation was from Google translation with some post translation cleanup of jumbled words or phrases by myself. Now as of Sept 12, the translation is by Nigel Calder. Hat tip to Carsten Arnholm of Norway for bringing this to my attention and especially for translation facilitation by Ágúst H Bjarnason – Anthony
Dr. Sebastian Lüning and Prof. Fritz Vahrenholt today here are asking how sea level rise is doing because as have not heard much about it lately. A good place to start is at Climate4You. Strangely the data go only until December 2016. And if you look at the data from the source form the University of Colorado, we find the same. So what’s with 2017?
by E. Garnier, septembre 2012, in Risques, les Cahiers de l’Assurance
Ce travail tente de prouver l’intérêt pour l’assureur d’une approche historique consacrée aux tempêtes et aux cyclones entre 1500 et nos jours. Les exemples de la France, de l’Europe et de l’océan Indien montrent que ces événements extrêmes sont en réalité des facteurs de permanence historique et que les archives peuvent être très utiles pour estimer leur sévérité. Dans cette perspective, une simulation du coût actuel de la tempête atlantique de mars 1937 est réalisée. Elle révèle que les sociétés littorales de cette époque étaient nettement plus résilientes. Enfin, l’étude prouve que, depuis la fin de la Seconde Guerre mondiale, la vulnérabilité a augmenté plus rapidement que l’aléa tempête, notamment depuis les années 1990 avec l’urbanisation croissante des littoraux.
We evaluate different hypotheses of the origin of the Little Ice Age, focusing on the long-term response of Arctic sea ice and oceanic circulation to solar and volcanic perturbations. We analyze the Last Millennium Ensemble of climate model simulations carried out with the Community Earth System Model at the National Center for Atmospheric Research. We examine the duration and strength of volcanic perturbations, as well as initial and boundary conditions such as the phase of the Atlantic Multidecadal Oscillation, and their impact on decadal to multi-centennial perturbations of the cryospheric, oceanic, and atmospheric components of the climate system.
The data for November 2017 HadCRUT4 (click on image to enlarge) has just been released by the UK Met Office. It is 0.547, better expressed as 14.55 +/- 0.10 °C. Given the substantial monthly variability evident in this database one has to be careful in drawing many conclusions about it. Given that, it is interesting to note that November 2017 is statistically the same as most Novembers of the so-called pause years, i.e. 1997, 2001, 2004, 2005, 2006, 2008, 2009, 2010, 2010, 2012, 2014 and even 2016.
by Tony Heller, November 9, 2017 in ClimateChangeDispatch
The animation below shows the extent of 5+ foot thick sea ice at present vs. the same date ten years ago. Ice thinner than five feet thick has been masked out.
by Ron Clutz, November 8, 2017, in ClimateChangeDispatch
The graph [after the jump] is noisy, but the density is needed to see the seasonal patterns in the oceanic fluctuations. Previous posts focused on the rise and fall of the last El Nino starting in 2015.
This post takes a longer view, encompassing the significant 1998 El Nino and since. The color schemes are retained for Global, Tropics, NH and SH anomalies.
Despite the long time frame, I have kept the monthly data (rather than yearly averages) because of interesting shifts between January and July.
Satellite measurements of Antarctic sea ice do not go back even 40 years. That’s not very much, especially when we consider that many natural climate cycles have periods of 60 years and more.
Luckily we have the field of climate reconstruction. Using historical documents and sediment cores, the development of ice cover can be estimated. In November, 2016, Tom Edinburg and Jonathan Day examined shipping log books from the time of Antarctic explorers and published on ice extent in The Cryosphere (…)
by Tony Heller, September 29, 2017 in DeplorableClimSciBlog
Ninety years ago brought the worst floods in US history. The Mississippi River was flooded for more than six months, forcing hundreds of thousands of people to abandon their homes permanently. Vermont’s worst flood on record occurred in November, 1927. The Red Cross described 1927 as the worst year in history.
by Javier, September 15, 2017, in Judith Curry Climate Etc.
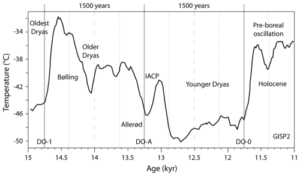
The existence of a 1500-year climatic cycle during the Holocene, related to the glacial Dansgaard-Oeschger cycle, is a matter of intense debate. However, by introducing precise timing requirements it can be shown that the 1500-year cycle displayed in Northern Hemisphere glacial records is also observed in Holocene records from all over the world.
The cycle is most prominently displayed in oceanic subsurface water temperatures, Arctic atmospheric circulation, wind deposits, Arctic drift ice, and storminess records.
by Paul Homewood, September 1, 2017 in NotaLotofPeopleKnowThat
Since 1851, there have been 14 stronger hurricanes at landfall, and Irma ties with 10 others. In other words, Irma is one of 25 hurricanes as strong or stronger.
Le cyclone Irma qui a dévasté Saint-Martin et Saint-Barthélémy dans les Antilles françaises a servi de prétexte à de nombreux commentateurs et journalistes pour en remettre une couche sur les “dérèglements climatiques d’origine humaine”. Comme d’habitude, les vagues éléments de prudence rappelant qu’on ne peut tirer de conclusions d’un élément isolé ont vite été noyés par les “appels à l’action” et l’invocation de l’Accord de Paris de 2015.
Or s’agissant du climat aux Antilles l’année 2015 a été importante pour une toute autre raison que la signature de l’Accord de Paris : c’est l’année de publication d’un article de recherche tout à fait passionnant sur les ouragans dans cette région du monde.
Changes in the sources of nitrogen and the composition of the phytoplankton community are more likely to account for the differences seen in the isotope data, Huckstadt said. “It looks more like a shift at the base of the food web, probably related to the transition from the Little Ice Age to current conditions, causing changes in the phytoplankton community,” he said.
See also: “Here we present new data from the Ross Sea, Antarctica, that indicates surface temperatures were ~ 2 °C colder during the LIA, with colder sea surface temperatures in the Southern Ocean and/or increased sea-ice extent, stronger katabatic winds, and decreased snow accumulation.”
Here’s another blow to the global warming alarmist scientists, who have been claiming that the Medieval Warm Period was a local, North Atlantic phenomenon, and did not really exist globally. What follows is a report on yet another paper contradicting this now worn out claim.
We suggest that solar activity may play a key role in driving the climatic fluctuations in North China during the last 22 centuries, with its quasi ∼100, 50, 23, or 22-year periodicity clearly identified in our climatic reconstructions.
We quantitatively illustrate that precipitation (67.4%) may have been more important than temperature (32.5%)…
La géologie, une science plus que passionnante … et diverse