A new temperature reconstruction, using proxy temperature measurements from locations in central Asia, has revealed that there has been no warming in the past 432 years.
The Global Warming “Hiatus” or Pause
The word “hiatus” became popular in recent years after the discovery of a pause or hiatus in global warming. There has been a lack of warming in the atmosphere since 1999, despite the predictions of computer climate models.
Could a transition in paleoclimate reconstruction be underway? More and more, scientists aren’t hiding statements or graphical depictions of the lack of modern warming or the much-warmer Holocene past.
A compilation of 35 papers from across the globe indicate that modern climate is not unusual, remarkable or unprecedented, and that large regions of the Earth were as warm or warmer than now when CO2 concentrations were much lower (260 to 350 ppm).
This development continues apace with the trends from the last two years, when 253 non-hockey stick papers were published.
After years of trying to suppress their release, and finally being ordered to be released by a judge, they are now public, and we have them here. This will remain as a “top post” for a day, new stories will be below this one.
There’s quite a treasure trove, but also some duplications from previous releases.
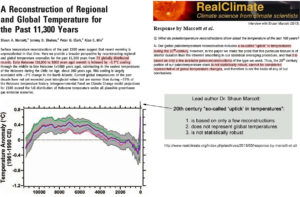
Almost immediately after it was introduced to the public, the lead author of Marcott et al. (2013) squelched the narrative that said the hockey-stick-shaped reconstruction he and his colleagues produced is a robust representation of modern global-scale temperature changes.
In an interview with Marcott published by RealClimate.org, it was acknowledged that the “uptick” does not represent a global-scale reconstruction, as it is based on only a few proxy records and lacks statistical significance.
…
Despite this admitted lack of supporting evidence for the 20th century’s “uptick”, the Marcott et al. (2013) “hockey stick”-shaped graph has nonetheless been unskeptically cited by other authors nearly 700 times.
By Dr. Sebastian Lüning and Prof. Fritz Vahrenholt
(Text translated by P Gosselin)
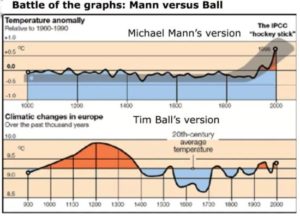
The hockey stick controversy over a temperature reconstruction of the past 2000 years represents an important stage in the climate debate. At around the turn of the millennium, the authors of the “hockey stick chart” suggested that the pre-industrial climate was monotonous and uneventful. The Medieval Warm Period and Little Ice Age described in many parts of the world climatically must have been very similar. But that’s hard to understand if you look at the wide variety of case studies.
Cover-up absurdity, then forced to correct
Later, the authors improved and presented a corrected version, which again showed stronger climatic fluctuations. Quite a science story. You can read about it here.
In addition to this scientific rush job, the debate about the hockey stick also showed that climate data really must be made publicly available. This is all the more important if the science is used for far-reaching policies. Data and results obtained thereof must be verifiable. At the time no one wanted the data to be released. Today in retrospect that was quite an absurdity — similar to smoking in a large open office.
During 2017, there were 150 graphs from 122 scientific papers published in peer-reviewed journals indicating modern temperatures are not unprecedented, unusual, or hockey-stick-shaped — nor do they fall outside the range of natural variability. We are a little over halfway through 2018 and already 108 graphs from 89 scientific papers undermine claims that modern era warming is climatically unusual.
For the sake of brevity, just 13 (15%) of the 89 new papers are displayed below.
The rest of the non-hockey-stick scientific papers and graphs published thus far in 2018 can be viewed by clicking the link below.
During 2017, there were 150 graphs from 122 scientific papers published in peer-reviewed journals indicating modern temperatures are not unprecedented, unusual, or hockey-stick-shaped — nor do they fall outside the range of natural variability. We are a little over 4 months into the new publication year and already 81 graphs from 62 scientific papers undermine claims that modern era warming is climatically unusual.
by M. Bastach, April 30, 2018 in ClimateChangeDispatch
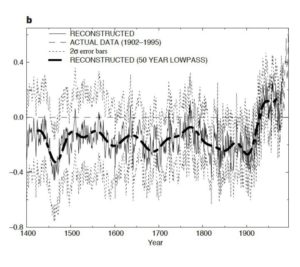
Roughly 20 years ago, climate scientist Michael Mann published his famous “hockey stick” graph that he says “galvanized climate action” by showing unprecedented global warming.
Mann used the 20-year anniversary of the graph to opine on the “industry-funded” attacks “to discredit the iconic symbol of the human impact on our climate,” which Mann claimed had withstood criticism.
“Yet, in the 20 years since the original hockey stick publication, independent studies, again and again, have overwhelmingly reaffirmed our findings, including the key conclusion: recent warming is unprecedented over at least the past millennium,” Mann wrote in Scientific American on April 20.
However, the two Canadian researchers who found serious flaws in the “hockey stick” study’s data and methodology disputed Mann’s characterization of the graph’s legacy.
Twenty years ago today: The infamous “hockey stick” graph that crystalized global warming and ignited the climate wars was published, and became known as MBH98. The science in it was so bad, it is credited with spawning the modern climate skeptic movement.
Original “hockey stick” temperature graph in Nature, 1998. The Y axis shows the Northern hemisphere mean temperature, in degrees Celsius; the zero line corresponds to the 1902 – 1980 mean. Credit: “Global-scale Temperature Patterns and Climate Forcing over the Past Six Centuries,” by Michael E. Mann et al. in Nature, Vol. 392, April 23, 1998
From Keele University and the “It’s like deja vu all over again” department with the leader of the “ship of fools” thrown in for comic relief. Long-time WUWT readers surely remember the single “Most influential tree in the world” from the Yamal fiasco, where the “signal” in one tree (YAD06) biased an entire paper with a hockey stick shape, making it worthless. Well, here we are again with another single tree used to define the entire globe. Obviously they’ve learned nothing, then again, it’s Chris Turney.
In the last 4 months, 40 more graphs taken from 30 more new peer-reviewed scientific papers have made their way into the ever-growing volume of evidence that today’s climate is not only not unprecedented or unusual in the context of the last millennium, but modern temperature values are still among the coldest of the last 10,000 years.
Well, Dr. James Hansen, the man who invented the global warming scam and our favorite failed serial doomcaster, recently addressed the cratering of a 30-year prediction he made in 1988.
Back then, he said the globe would warm up by one full degree by 2018 under the “business as usual” rubric … not. Here’s the story as written up in “Spin” magazine in 1988.
In understanding climate change risk, and deciding on the ‘if’ and ‘what’ of ‘action’, we need to acknowledge that we don’t know how the climate of the 21st century will play out (Deep Uncertainty, folks). Four possibilities:
It is possible that human-caused climate change will be swamped by much larger natural climate variability.
It is possible/plausible that the sensitivity of the climate is on the low end of the IPCC envelope (1.0-1.5C), with a slow creep of warming superimposed on much larger natural variability.
It is possible/plausible that the IPCC projections are actually correct (right for the wrong reasons; too much wrong with the climate models for much credibility, IMO).
It is possible that AGW and natural variability could conspire to cause catastrophic outcomes
Penn State climate scientist, Michael ‘hockey stick’ Mann commits contempt of court in the ‘climate science trial of the century.’ Prominent alarmist shockingly defies judge and refuses to surrender data for open court examination

