Archives par mot-clé : Ocean

Arctic “Just-So Stories”: Bad Science by Climate Alarmists

by J. Steele, Feb 14, 2024 in WUWT


The Arctic Ocean was nick-named the “upside down Ocean” by Fridtjof Nansen. Nansen was a famous Norwegian zoologists, oceanographer, and Arctic explorer as well as winner of the 1922 Nobel Peace Prize. During his failed expedition to reach the North Pole, his boat, the Fram, got frozen in Arctic sea ice but eventually was exported by Arctic currents, along with Arctic sea ice, into the Atlantic through what is now named the Fram Strait.

Nansen named the Arctic Ocean the “upside down ocean” because contrary to other oceans, the surface waters are the coldest, while between 100 and 900-meters depths the ocean is warmer due to inflows and storage of warm salty Atlantic waters. Sea ice cover prevents the ventilation of that stored heat. However, increases in open water allows more heat ventilation which has raised Arctic air temperatures 2 to 7 times faster than the global average. Open waters have been increasing due to changes in wind direction and currents. Open water is not proof of melting.

NASA estimates that globally added CO2 has increased downward infrared and added “a little over 0.8 Watts per square meter” of energy which their Just So stories claim melted sea ice. But researchers (e.g. Kim 2019) have reported that over open water more winter heat, about 2 Watts per meter squared, is being ventilated heat away more than absorbed. That suggests radiative cooling!

Oceans Retain Methane: New ‘Nature’ Study Finds Very Little Danger Of Methane Reaching Surface

by P. Gosselin, Aug 11,2023 in WUWT


Global warming alarmists have often used the scenario of increased methane in the atmosphere accelerating warming and climatic change.

But a recent study appearing in NatureNegligible atmospheric release of methane from decomposing hydrates in mid-latitude oceans, dumps a lot cold water on this scenario. This is good news, which unfortunately the media refused to report.

At the bottom of the sea, there are large deposits of naturally occurring methane hydrate. There’s a fear that these ice-like deposits could melt and be released into the atmosphere if the oceans warmed. Methane is a far more powerful greenhouse gas than CO2. The researchers looked at the concentration and natural radiocarbon content of methane dissolved in the water column from the seafloor to the sea surface at seep fields along the US Atlantic and Pacific margins.

No methane reached the surface

Their measurements revealed no evidence of seep CH4 reaching surface waters when the water-column depth is greater than 430 ± 90 m. “Gas hydrates exist only at water depths greater than ~550 m in this region, suggesting that the source of methane escaping to the atmosphere is not from hydrate decomposition,” the authors add.

Dissolves in the ocean

In 2016, a paper published in the Reviews of Geophysics concluded that the annual emissions of methane to the ocean from degrading gas hydrates are far smaller than greenhouse gas emissions to the atmosphere from human activities and that most of the methane released by gas hydrates never even reaches the atmosphere. The methane often remains in the undersea sediments, dissolves in the ocean, or is converted to carbon dioxide by microbes.

Where Does Ocean Heat Come From?

by Dr M. Wielicki, May 24, 2023 in ClimateChangeDispatch


First, do we really know the temperature and thus heat content of the ocean?

The ocean is vast and covers ~70% of the Earth’s surface, making it the largest system on the planet. Despite its size, only a small portion of the ocean has been explored and mapped in detail.

It is estimated that <20% of the world’s oceans have been mapped and explored to date. [emphasis, links added]

This is largely due to the difficulties and challenges associated with ocean exploration, such as the high pressure and extreme environments found in the deep ocean, as well as the high cost of research vessels, equipment, and technology.

Most of the ocean that has been explored in detail is located near the coasts or in shallow waters, where it is more accessible to research vessels and equipment, but usually far away from the heat sources of mid-ocean ridges.

The deep ocean, which makes up the majority of the ocean’s volume, remains largely unexplored, with less than 5% of the ocean floor having been mapped in high resolution.

Advances in technology, such as underwater drones and submersibles, are helping to improve our understanding of the ocean and its ecosystems, and it is likely that our knowledge of the ocean will continue to expand in the coming decades.

Temperature measurements in the ocean are typically taken using a variety of instruments. These instruments can be deployed from research vessels or from moored or drifting buoys, and they collect temperature data at different depths throughout the ocean.

The amount of the ocean that is measured for temperature varies depending on the method of measurement and the specific objectives of the research.

However, it is estimated that significantly less than 10% of the world’s oceans have been sampled for temperatures at depths greater than 2,000 meters.

Despite the relatively limited coverage of temperature measurements in the deep ocean, there are ongoing efforts to improve our understanding of the ocean’s temperature structure and variability.

Intense, Long-Lasting Heatwaves Unfolding At The Bottom Of The Ocean

by G. Dickie, Mar 16, 2023 in ClimateChangDispatch


Heatwaves unfolding on the bottom of the ocean can be more intense and last longer than those on the sea surface, new research suggests, but such extremes in the deep ocean are often overlooked.

A team of scientists with the U.S. National Oceanic and Atmospheric Administration has conducted the first assessment of marine heatwaves along North America’s continental shelves.

They found that these bottom heatwaves ranged from 0.5 degrees Celsius to 3C warmer than normal temperatures and could last more than six months — much longer than heatwaves at the surface.

“We simply don’t have a ton of instruments on the ocean bottom along continental shelves,” said study co-author Dillon Amaya, an NOAA climate scientist. “The ocean is a powerful thing. It destroys instruments that we have in the water for too long.

Surface heatwaves can be picked up by satellites and can result in huge algal blooms.

PAGES2019: 30-60S

by S. McIntyre, Aug 26, 2021 in ClimateAudit


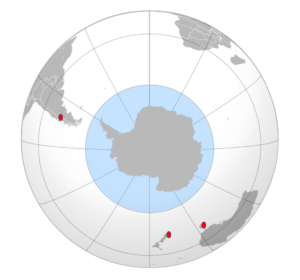
The 30-60N latitude band gets lots of attention in paleoclimate collections – probably more proxies than the rest of the world combined. The 30-60S latitude band is exactly the same size, but it is little studied. It is the world of the Roaring Forties and Furious Fifties, a world that is almost entirely ocean. The only land is New Zealand, Tasmania and the southern coast of Australia facing Antarctica, the tip of South Africa and the narrow part of South America: southern Chile and Argentina. But 96% or so is ocean.


Conclusion

Given that the 60-30S latband is almost entirely ocean, it seems logical that IPCC and PAGES2K should use data from ocean proxies to estimate past temperature in this latitude band. But this isn’t what they’ve done. Instead, they’ve purported to estimate past temperature from a few scattered tree ring chronologies, only one of which reaches earlier than AD1850; and an idiosyncratic singleton pigment series. Ironically, the only 30-60S proxy series in PAGES 2019 that reaches back into the first millennium – the Mount Read, Tasmania tree ring series – was used by Mann et al 1998-1999, Jones et al 1998 and numerous other supposedly “independent” multiproxy studies. Neither of the two series reaching back to the medieval period permit the conclusion that modern period is warmer than medieval period. Caveat: I’m not saying that it isn’t; only that this data doesn’t show it, let alone support the big-bladed HS cited by IPCC. High-resolution alkenone measurements from ocean cores offshore Chile show a consistent decrease in ocean temperatures over the past two millennia that is neither reported nor discussed by IPCC (or PAGES 2019).

To be clear, some of the technical articles on 30-60S ocean core proxies by specialist authors are truly excellent and far more magisterial than the IPCC mustered, in particular, several articles on offshore Chile. Here are a few:

Mohtadi et al, 2007. Cooling of the southern high latitudes during the Medieval Period
and its effect on ENSO link

Killian and Lamy 2012. A review of Glacial and Holocene paleoclimate records from southernmost Patagonia (49-55degS) link

Collins et al 2019. Centennial‐Scale SE Pacific Sea Surface Temperature Variability Over the Past 2,300 Years link

Ocean Temperature Limit – Corrections and Part 4

by R. Willoughby, May 29, 2021 in WUWT


(The author appreciates the availability NASA’s Earth Observations satellite data sets used in this analysis.)

Now a four part series that analyses the role of atmospheric water in regulating Earth’s thermal balance.

Part 1 An analysis of the temperature of tropical ocean warm pools and the temperature limiting processes

Part 2 Discusses the mechanism of deep convection concluding with the persistency of clouds over ocean warm pools.

Part 3 Examines the global ocean energy balance over an annual cycle month-by-month to identify the role of atmospheric water in regulating the energy balance.

Part 4:  The Atmospheric Gear Change

Total Precipitable Water & Level of Free Convection


REVEALED: Al Gore’s real climate catastrophe

by Ian Plimmer & John Ruddick, Apr 29, 2021 in SpectatorAustralia


Next month is the thirtieth anniversary of the most entertaining and damning chapter in Al Gore’s career.

By the mid-nineteenth century, our knowledge of atmospheric chemistry was sufficiently advanced for a few sharp minds to ponder whether an increase in carbon dioxide might increase global temperature.  The speculation remained entirely theoretical until 1957 when an international collaboration of top geophysicists — including the Soviets — used buoys, weather balloons and so forth to collect data.  The undertaking was led by Dr Roger Revelle then based at California’s Scripps Institute of Oceanography.  Today’s global warming debate is hyper-partisan but all agree Revelle’s standing is impeccable.

Before this research, many assumed the ocean was absorbing most of the increase in carbon dioxide caused by industrialisation.  Revelle’s data, however, indicated only half was. So what was happening to the other half?  Would the planet soon overheat?

Oceanic Warming? Well, sorta.

by W. Eschenbach, May 1, 2021 in WUWT


After my last post about the surface warming of the ocean, entitled “How Global Warming Isn’t“, I got to thinking about the warming of the upper part of the ocean. So I got the data for the ocean heat content (OHC) of the top 700 metres of the ocean from the marvelous site, KNMI. If you look under “Monthly Observations” you’ll find a host of most fascinating datasets. Under “Heat Content” on that page, you’ll find the National Oceanic Data Center (NODC) 0-700 metre depth OHC data. And down at the very bottom of that page is a link that will download a 196 megabyte gridded NetCDF file containing the data that I used. (Big file, click at your own risk.)

And what did I find? Well, I’m a visual kind of guy. I mean, I can do the math, but it only makes sense when it comes up as a picture on the silver screen. So here are my graphics. I’m interested in the changes in the oceanic heat content, so these are two views of those trends.

This is the bottom line. If the world’s creatures, both on land and at sea, were as temperature-sensitive as the alarmists would have us believe, those beings (and we humanoids as well) all would have gone extinct long ago. And near as I can tell, that hasn’t occurred … at least yet.

Twice as much carbon flowing from land to ocean than previously thought

by Institute for Basic Science, March 18, 2021 in WUWT 


Every year 600-900 million tons of carbon flow through rivers to the ocean either as particles or in dissolved form. Researchers have known for a long time that this does not represent the total amount of carbon that gets transported from the land to the ocean. But the remaining contributors mostly from coastal ecosystems, such as carbon-rich mangrove forests, and from groundwater discharge into the ocean have been notoriously difficult to measure.

A new study published in the journal Global Biogeochemical Cycles and spearheaded by Dr. Eun Young Kwon, project leader at the IBS Center for Climate Physics South Korea provides new estimates of this elusive component of the global carbon cycle. The study makes use of the existence of two stable carbon isotopes, 12C and 13C, with the latter being slightly heavier, because it has one more neutron in its nucleus. The concentration ratio between these two carbon isotopes (referred to as ?13C) provides a means to track carbon through the different components of the carbon cycle, including the atmosphere, oceans, river systems and the biosphere. Knowing the typical ?13C value of land biosphere and for coastal vegetation, one can now track how this quantity gets diluted in the oceans. “The carbon isotope values act like an invisible dye that tells us something about the source where it came from and how much got released initially” says Dr. Kwon, lead author of the study.

Major February global temperature drop reveals the real climate control knob

by J. Bastardi, March 7, 2021 in CFACT


By now all of you know my belief ( bias) that it’s the oceans, and more so the tropical oceans, that are the biggest control knob of the weather and climate. If you really wanted to make this a controlled classroom experiment (nature is not a classroom with easy controls)  then I venture to say that the real way to know man’s influence is to have SST’s return to where they were in the 1970s, give it a couple of years for the water vapor adjustment, ( and if I am right. co2 will adjust as warmer oceans outsource it, so the outsourcing to the air will decrease) and see the difference there. And there you may be able to make an irrefutable argument for man’s contribution, Unfortunately for those who will not look at anything else,  that is likely to be quite small, but on the other hand, unlike the warming we have had which is really in the coldest driest places and more so at their coldest driest time of the year, you would likely find the lions share of what warming would be where life thrives.. As small as that has been, less than .25C of the numbers we see all the time that tell us that at. a bit over 59 degrees the planet is overheating, it is liable to be even less detectable and certainly as or more adaptable than what we seemed to have adapted to nicely here.

But the fear of course is runaway warming which is interesting since it counters Le Chateliers,  which I never hear anyone bring up, most likely because it’s a simple explanation. And a simple explanation would impact a lot of things relying on a done deal, complex explanation that the public must accept because they could never understand.

Warmer Than Thought? GWPF Science Editor Sceptical About New Ocean-Warming Paper

by RFI, Jan 12, 2021 in GWPF


A new report published in the US journal Science, led by the Chinese Academy of Sciences, suggests the world’s oceans are warming 40 percent faster than what a UN panel predicted five years ago. Although data collection is more accurate than in the past, some experts advise against jumping to hasty conclusions.

About 93 percent of excess heat trapped around the Earth by greenhouse gases that come from the burning of fossil fuels accumulates in the world’s oceans.

The UN Intergovernmental Panel on Climate Change (IPCC) says ocean warming has led to rising sea levels and contributes to increases in rainfall intensity, more violent storms and the destruction of coral reefs.

It is also a threat to biodiversity and one of the earth’s major food supplies.

“Ocean heating is a very important indicator of climate change, and we have robust evidence that it is warming more rapidly than we thought,” said co-author Zeke Hausfather, a graduate student in the Energy and Resources Group at the University of California, Berkeley.

Their report relied on four studies, published between 2014 and 2017 whose conclusions are based on measurements recorded by a fleet of some 4,000 floating robot monitors called Argo.

The robots drift throughout the world’s oceans, every few days diving to a depth of 2,000 meters and measuring the ocean’s temperature, pH, salinity and other information.

Argo “has provided consistent and widespread data on ocean heat content since the mid-2000s,” the report said.

The new analysis shows warming in the oceans is on pace with measurements of rising air temperature.

And if nothing is done to reduce greenhouse gases, “models predict that the temperature of the top 2,000 meters of the world’s oceans will rise 0.78 degrees Celsius by the end of the century,” it said.

Caution needed when interpreting results

David Whitehouse, the science editor for the Global Warming Policy Forum, based in the UK says we must very careful when drawing conclusions.

Continuer la lecture de Warmer Than Thought? GWPF Science Editor Sceptical About New Ocean-Warming Paper

Sea surface skin temperature

by A. May, Dec 9, 2020 in WUWT


In previous posts, see here and here, I’ve tried to show that because the oceans cover 71% of Earth and they contain 99% of the thermal energy stored on the Earth’s surface, they dominate the speed and magnitude of climate changes. In all my posts the Earth’s surface is defined as everything from the ocean floor to the top of the atmosphere. The details of the calculation of ocean and atmospheric heat content is detailed in this spreadsheet. The ocean’s huge heat capacity prevents large temperature swings and dampens and delays those that do occur.

Attempting to show the direction, speed, and magnitude of climate change by measuring and averaging atmospheric surface temperatures is pointless, in my opinion. The record we have of atmospheric and ocean surface temperatures is too short and far too inaccurate to provide us with useful trends on a climatic (30 years +) time scale. Further, these records are sporadic measurements in a chaotic surface zone that has large temperature swings. In Montana, United States, for example, recent minimum/maximum temperatures have been as low as -70°F (-57°C) and as high as 117°F (47°C). These enormous swings make measuring year-to-year global average differences of 0.1°C exceedingly difficult. Yet, this is the precision demanded if we are to properly characterize a climate that is only warming at a rate of roughly 1.4°C/century, which is 0.014°C per year and 0.14°C/decade.

Undersea earthquakes shake up climate science

by C. Rotter, Sep 20, 2020 in WUWT


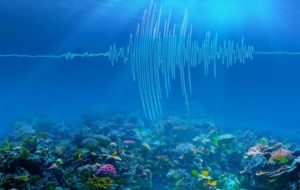
Despite climate change being most obvious to people as unseasonably warm winter days or melting glaciers, as much as 95 percent of the extra heat trapped on Earth by greenhouse gases is held in the world’s oceans. For that reason, monitoring the temperature of ocean waters has been a priority for climate scientists, and now Caltech researchers have discovered that seismic rumblings on the seafloor can provide them with another tool for doing that.

In a new paper publishing in Science, the researchers show how they are able to make use of existing seismic monitoring equipment, as well as historic seismic data, to determine how much the temperature of the earth’s oceans has changed and continues changing, even at depths that are normally out of the reach of conventional tools.

They do this by listening for the sounds from the many earthquakes that regularly occur under the ocean, says Jörn Callies, assistant professor of environmental science and engineering at Caltech and study co-author. Callies says these earthquake sounds are powerful and travel long distances through the ocean without significantly weakening, which makes them easy to monitor.

Wenbo Wu, postdoctoral scholar in geophysics and lead author of the paper, explains that when an earthquake happens under the ocean, most of its energy travels through the earth, but a portion of that energy is transmitted into the water as sound. These sound waves propagate outward from the quake’s epicenter just like seismic waves that travel through the ground, but the sound waves move at a much slower speed. As a result, ground waves will arrive at a seismic monitoring station first, followed by the sound waves, which will appear as a secondary signal of the same event. The effect is roughly similar to how you can often see the flash from lightning seconds before you hear its thunder.


IMAGE: AN ARTIST’S RENDERING OF UNDERSEA EARTHQUAKE WAVES. view more CREDIT: CALTECH

Acid Oceans? & Oyster Shells

by Jim Steele, July 14, 2020 in WUWT


(I wrote a white paper for the CO2  Coalition, providing more details and references to peer reviewed science regards how marine life counteracts ocean acidification. That paper can be downloaded here )

Search the internet for “acid oceans” and you’ll find millions of articles suggesting the oceans are becoming more corrosive due the burning of fossil fuels, and “acid oceans” are threatening marine life. Although climate modelers constantly claim the oceans’ surface pH has dropped since the 1800s, that change was never measured, as the concept of pH was not created until the early 1900s by beer-makers.

In 2003 Stanford’s Dr. Ken Caldeira coined the term “ocean acidification” to generate public concern about increasing CO2  . As New Yorker journalist Elizabeth Kolbert reported, “Caldeira told me that he had chosen the term ‘ocean acidification’ quite deliberately for its shock value. Seawater is naturally alkaline, with a pH ranging from 7.8 to 8.5—a pH of 7 is neutral—which means that, for now, at least, the oceans are still a long way from actually turning acidic.” Nonetheless Caldeira’s term “ocean acidification” evoked such undue fears and misunderstandings, we are constantly bombarded with catastrophic media hype and misdiagnosed causes of natural change.

For example, for nearly a decade the media has hyped the 2006-2008 die-off of larval oysters in hatcheries along Washington and Oregon. They called it a crisis caused by rising atmospheric CO2  and the only solution was to stop burning fossil fuels. But it was an understanding of natural pH changes that provided the correct solutions. Subsurface waters at a few hundred meters depth naturally contain greater concentrations CO2  and nutrients and a lower pH than surface waters. Changes in the winds and currents periodically bring those waters to the surface in a process called upwelling. Upwelling promotes a burst of life but also lowers the surface water pH.  Not fully aware of all the CO2  dynamics, the hatcheries had made 3 mistakes.

Arctic Ocean changes driven by sub-Arctic seas

by University of Alaska Fairbank, July 12, 2020 in WUWT


New research explores how lower-latitude oceans drive complex changes in the Arctic Ocean, pushing the region into a new reality distinct from the 20th-century norm.

The University of Alaska Fairbanks and Finnish Meteorological Institute led the international effort, which included researchers from six countries. The first of several related papers was published this month in Frontiers in Marine Science.

Climate change is most pronounced in the Arctic. The Arctic Ocean, which covers less than 3% of the Earth’s surface, appears to be quite sensitive to abnormal conditions in lower-latitude oceans.

“With this in mind, the goal of our research was to illustrate the part of Arctic climate change driven by anomalous [different from the norm] influxes of oceanic water from the Atlantic Ocean and the Pacific Ocean, a process which we refer to as borealization,” said lead author Igor Polyakov, an oceanographer at UAF’s International Arctic Research Center and FMI.

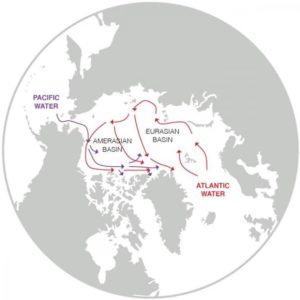
Although the Arctic is often viewed as a single system that is impacted by climate change uniformly, the research stressed that the Arctic’s Amerasian Basin (influenced by Pacific waters) and its Eurasian Basin (influenced by Atlantic waters) tend to differ in their responses to climate change.

Since the first temperature and salinity measurements taken in the late 1800s, scientists have known that cold and relatively fresh water, which is lighter than salty water, floats at the surface of the Arctic Ocean. This fresh layer blocks the warmth of the deeper water from melting sea ice.

IMAGE: A MAP OF THE ARCTIC OCEAN SHOWS THE LOCATION OF THE AMERASIAN AND EURASIAN BASINS. ARROWS SHOW THE PATH OF WARM, FRESH PACIFIC WATER AND WARM, SALTY ATLANTIC WATER INTO… view more CREDIT: GRAPHIC ADAPTED FROM POLYAKOV ET AL. 2020, FRONTIERS IN MARINE SCIENCE PAPER.

Extensive hake (fish) skeletal remains in ocean waters too cold for this species to occupy today suggest past ocean temperatures were several degrees warmer.

by Wheeland & Morgan, July 2020 in NoTricksZone


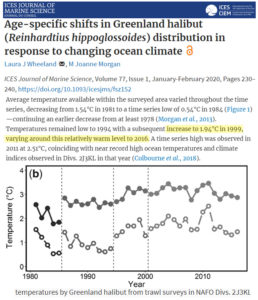
Fish habitats are limited by specific temperature boundaries. In a new study, for example,  Wheeland  and Morgan (2020) found there was a pronounced ocean warming from the 1980s to late 1990s off the coasts of Greenland. This temperature shift changed the distribution of halibut habitat. Since then, however, there has been no net warming in the study region (through 2016).

Podcast: Why the Oceans Really Aren’t “Acidifying” but the Term Is Being Abused by Science and Media

by A. Watts, June 11, 2020 in WUWT


Science and media outlets claim ocean acidification is happening due to increased carbon dioxide in the atmosphere. But objective data show the ocean is far from acidic according to Dr. Caleb Rossiter, executive director of the CO2 Coalition and a statistician who has studied climate change closely.

Host Anthony Watts and Rossiter talk about how a pH of 7 is considered neutral, with anything below 7 considered acidic. Ocean pH averages 8.1, which is alkaline rather than acidic. Although climate models suggest the ocean’s surface pH may have dropped from pH 8.2 to 8.1 since 1750, that change was never actually measured.

The pH drop from 1850 is merely a modeled conjecture. The concept of pH was first introduced by in 1909, and agriculturalists first developed field instruments to measure pH in the 1930s.

Causes of the Rapid Warming of the North Atlantic Ocean in the Mid-1990s

by P. Homewood, April 9, 2020 in NotaLotofpeopleKnowThat


http://ocean.dmi.dk/arctic/icecover_30y.uk.php

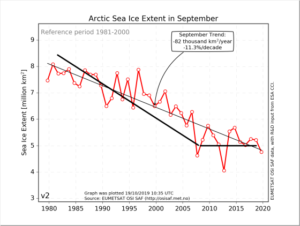
Most of us are probably familiar with the pattern of Arctic sea ice decline between 1979 and 2007, followed by a period of relative stability. Most of the decline took place after the mid 1990s.

The decline is nearly always explained away as the result of global warming, but a couple of old studies show this not to be the case.

In 2011, Robson & Sutton found that the sub polar gyre underwent remarkable and rapid warming in the mid 1990s, and that this was linked to changes in the North Atlantic Oscillation:

The Solution To Dissolution

by Willis Eschenbach, January 31, 2020 in WUWT


The British tabloid “The Guardian” has a new scare story about what is wrongly called “ocean acidification”. It opens as follows:


Pacific Ocean’s rising acidity causes Dungeness crabs’ shells to dissolve

Acidity is making shells of crab larvae more vulnerable to predators and limiting effectiveness in supporting muscle growth


The Pacific Ocean is becoming so acidic it is starting to dissolve the shells of a key species of crab, according to a new US study.


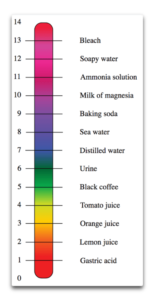
Sounds like the end of times, right? So let me start with a simple fact. The ocean is NOT acidic. Nor will it ever become acidic, except in a few isolated locations. It is alkaline, also called “basic”. The level of acidity/alkalinity is expressed on the “pH” scale, where neutral is 7.0, alkaline is from 7 to 14, and acidic is from 0 to 7.

Figure 1. The pH scale, running from the most acid at the bottom, through neutral in the middle, and up to the most alkaline at the top.

From the chart, the ocean has a pH of around 8 (although as we’ll see, that conceals great variation).


DEEP DIVING SCIENTISTS DISCOVER “SODA SPRINGS” — AN UNDERWATER ENVIRONMENT WHERE HIGH CO2 CONCENTRATIONS (UP TO 95,000 PPM) BUBBLE-UP FROM THE OCEAN FLOOR

by Cap Allon, January 27, 2020 in Electroverse


University of Texas at Austin Professor, Bayani Cardenas, has discovered an underwater environment of bubbling carbon dioxide with readings some 200x the concentration of CO2 in the atmosphere.

Cardenas discovered the region –which he calls “Soda Springs”– while studying how groundwater from a nearby island could affect the ocean environment of the Verde Island Passage in the Philippines. The passage is one of the most diverse marine ecosystems in the world and is home to thriving coral reefs.

The amazing bubbling location, which Cardenas captured on video, is not a climate change nightmare, reads part of the press release issued by utexas.edu on Jan 22, 2020. It is instead linked to a nearby volcano that vents out the gases through cracks in the ocean floor, and has probably been doing so for decades or even millennia.

Continuer la lecture de DEEP DIVING SCIENTISTS DISCOVER “SODA SPRINGS” — AN UNDERWATER ENVIRONMENT WHERE HIGH CO2 CONCENTRATIONS (UP TO 95,000 PPM) BUBBLE-UP FROM THE OCEAN FLOOR

Des réchauffements répétitifs sans CO2 ?

by P. Berth & A. Préat, 24 janvier 2020 in ScienceClimatEnergie


Depuis le début des mesures thermométriques directes, les 4 principales séries de température  que nous possédons (thermomètres terrestres et satellites) nous montrent que la température globale de la basse troposphère a augmenté de ± 0,8°C en 138 ans (entre 1880 et 2018). Cela correspond à ± 0,28°C en 50 ans soit 0,006°C/an(actuellement environ 0,01°C/an pour les 30 dernières années). Les médias nous rappellent chaque jour que cette hausse est exceptionnelle et que le CO2 anthropique en est à l’origine, c’est-à-dire est le grand coupable suivant la terminologie consacrée.

Mais cette vitesse d’augmentation de la température, est-elle vraiment exceptionnelle? Dans les lignes qui suivent, nous allons vous démontrer qu’il n’en est rien. Au cours de la dernière période glaciaire, alors que l’espèce humaine existait déjà, la température moyenne a parfois augmenté à une vitesse vingt fois plus élevée, et ce à de nombreuses reprises. Ces phénomènes particuliers, qui n’ont pas fait disparaître la vie sur Terre, et que nous vous avions déjà mentionnés sur SCE (ici), sont appelés évènements de Dansgaard-Oeschger ou ‘DO’ (des noms des deux scientifiques -danois et suisse-  qui furent les premiers à les mettre en évidence) et sont reconnus par le GIEC. Comme nous allons vous le montrer dans le présent article, le taux de CO2 n’aurait qu’un rôle mineur dans ces évènements.

Figure 1. Stratigraphie isotopique de l’oxygène à partir des glaces du forage GRIP (Groenland).
En ordonnée valeurs du δ
18O en ‰ et en abscisse profondeur en mètres du forage (Cronin, 2010). Les compositions isotopiques de l’oxygène sont un indicateur de la température. La figure montre de manière très claire que l’interglaciaire actuel (Holocène, moitié gauche du graphique) est caractérisé par des fluctuations thermiques de faible amplitude (si l’on excepté un épisode plus froid vers 8,2 ka) alors que le Dernier Glaciaire (moitié droite du graphique) montre des changements climatiques fréquents, rapides et de grandes amplitudes (de 8°C à 16°C suivant les δ18O) enregistrés pas les événements ou ‘cycles’ DO (Dansgaard-Oeschger events). Nb: YD pour Younger Dryas, correspondant à un refroidissement il y a 12800 ans BP (non discuté dans cet article).


New 80-Year Deep-Ocean Temperature Dataset Compared to a 1D Climate Model

by Roy Spencer, January 15, 2020 in WUWT/Ch.Rotter


The increasing global ocean heat content (OHC) is often pointed to as the most quantitative way to monitor long-term changes in the global energy balance, which is believed to have been altered by anthropogenic greenhouse gas emissions. The challenge is that long-term temperature changes in the ocean below the top hundred meters or so become exceedingly small and difficult to measure. The newer network of Argo floats since the early 2000s has improved global coverage dramatically.

A new Cheng et al. (2020) paper describing record warm ocean temperatures in 2019 has been discussed by Willis Eschenbach who correctly reminds us that such “record setting” changes in the 0-2000 m ocean heat content (reported in Zettajoules, which is 10^^21 Joules) amount to exceedingly small temperature changes. I calculate from their data that 2019 was only 0.004 0.009 deg. C warmer than 2018.

Over the years I have frequently pointed out that the global energy imbalance (less than 1 W/m2) corresponding to such small rates of warming is much smaller than the accuracy with which we know the natural energy flows (1 part in 300 or so), which means Mother Nature could be responsible for the warming and we wouldn’t even know it.

The Cheng (2017) dataset of 0-2000m ocean heat content changes extends the OHC record back to 1940 (with little global coverage) and now up through 2019. The methodology of that dataset uses optimum interpolation techniques to intelligently extend the geographic coverage of limited data. I’m not going to critique that methodology here, and I agree with those who argue creating data where it does not exist is not the same as having real data. Instead I want to answer the question:

If we take the 1940-2019 global OHC data (as well as observed sea surface temperature data) at face value, and assume all of the warming trend was human-caused, what does it imply regarding equilibrium climate sensitivity (ECS)?

Fig. 1. Deep-ocean temperature variations 1940-2019 explained with a 2-layer energy budget model forced with RCP6 radiative forcing scenario and a model climate sensitivity of 1.85 deg. C. The model also matches the 1940-2019 and 1979-2019 observed sea surface temperature trends to about 0.01 C/decade. If ENSO effects are not included in the model, the ECS is reduced to 1.7 deg. C.

Throwing More Cold Water On An Alarmist Ocean-Warming Paper

by Dr. D. Whitehouse, January 17, 2020 in ClimateChangeDispatch


It’s the usual story. It’s the beginning of the year and the statistics of the previous year are hurriedly collected to tell the story of the ongoing climate crisis.

First off, we have the oceans which, according to some, are living up to the apocalyptic narrative better than the atmosphere.

The atmosphere is complicated, subjected to natural variabilities, that make the temperature increase open to too much interpretation.

The oceans, however, are far more important than the air as they absorb most of the anthropogenic excess heat.

Looking at the literature reveals no one knows just how much excess heat (created in the atmosphere) it mops up or indeed exactly how or where it does it. Some say it is 60% which is a bit on the low side, most say 90% or 93%.

The real figure is unknown though it should be noted that a few percent errors translate to a lot of energy, about the same amount that is causing all the concern.

On 14 January the Guardian had the headline, “Ocean temperatures hit record high as the rate of heating accelerates.” The study that reached this conclusion was published in the journal Advances in Atmospheric Sciences.

It’s a badly written paper full of self-justifying statements and unwarranted assumptions that should have been stripped-out by the editor.


Also : Ocean Warming: Not As Simple As Headlines Say

The Ocean Warms By A Whole Little

by Willis Eschenbach, January 4, 2020 in WUWT


How much is a “Whole Little”? Well, it’s like a whole lot, only much, much smaller.

There’s a new paper out. As usual, it has a whole bunch of authors, fourteen to be precise. My rule of thumb is that “The quality of research varies inversely with the square of the number of authors” … but I digress.

In this case, they’re mostly Chinese, plus some familiar western hemisphere names like Kevin Trenberth and Michael Mann. Not sure why they’re along for the ride, but it’s all good. The paper is “Record-Setting Ocean Warmth Continued in 2019“. Here’s their money graph:


Figure 1. Original Caption: “Fig. 1. (a) Upper 2000 m OHC from 1955 through 2019. The histogram represents annual anomalies (units: ZJ), wherein positive anomalies relative to a 1981−2010 baseline are shown as red bars and negative anomalies as blue. The two black dashed lines are the linear trends over 1955–86 and 1987−2019, respectively.”


So here’s the hot news. According to these folks, over the last sixty years, the ocean has warmed a little over a tenth of one measly degree … now you can understand why they put it in zettajoules—it’s far more alarming that way.

Next, I’m sorry, but the idea that we can measure the temperature of the top two kilometers of the ocean with an uncertainty of ±0.003°C (three-thousandths of one degree) is simply not believable.

Also Ocean Warming Scares

Also : New 80-Year Deep-Ocean Temperature Dataset Compared to a 1D Climate Model

Ocean acidification a big problem — but not for coral reef fish behavior

by Norwegian University of Science and Technology, Jan. 9, 2020 in WUWT


A three-year, comprehensive study of the effects of ocean acidification challenges previous reports that a more acidic ocean will negatively affect coral reef fish behaviour.

The study, conducted by an international coalition led by scientists from Australia and Norway, showed that coral reef fish exposed to CO2 at levels expected by the end of the century did not change their activity levels or ability to avoid predators.

“Contrary to previous studies, we have demonstrated that end-of-century CO2 levels have a negligible impact on the behaviour and sensory systems of coral reef fish,” said Timothy Clark, the lead author of the study and an associate professor at Deakin University in Australia.

Although this is good news on its own, ocean acidification and global warming remain a major problem for coral reefs, the researchers said. Ocean acidification is a problem for creatures that rely on calcium carbonate to make shells and skeletons, such as coral reef organisms, while higher ocean temperatures lead to coral bleaching and death.

..