Archives par mot-clé : Proxies

PAGES2019: 30-60S

by S. McIntyre, Aug 26, 2021 in ClimateAudit


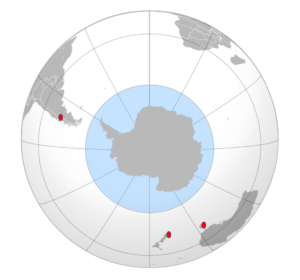
The 30-60N latitude band gets lots of attention in paleoclimate collections – probably more proxies than the rest of the world combined. The 30-60S latitude band is exactly the same size, but it is little studied. It is the world of the Roaring Forties and Furious Fifties, a world that is almost entirely ocean. The only land is New Zealand, Tasmania and the southern coast of Australia facing Antarctica, the tip of South Africa and the narrow part of South America: southern Chile and Argentina. But 96% or so is ocean.


Conclusion

Given that the 60-30S latband is almost entirely ocean, it seems logical that IPCC and PAGES2K should use data from ocean proxies to estimate past temperature in this latitude band. But this isn’t what they’ve done. Instead, they’ve purported to estimate past temperature from a few scattered tree ring chronologies, only one of which reaches earlier than AD1850; and an idiosyncratic singleton pigment series. Ironically, the only 30-60S proxy series in PAGES 2019 that reaches back into the first millennium – the Mount Read, Tasmania tree ring series – was used by Mann et al 1998-1999, Jones et al 1998 and numerous other supposedly “independent” multiproxy studies. Neither of the two series reaching back to the medieval period permit the conclusion that modern period is warmer than medieval period. Caveat: I’m not saying that it isn’t; only that this data doesn’t show it, let alone support the big-bladed HS cited by IPCC. High-resolution alkenone measurements from ocean cores offshore Chile show a consistent decrease in ocean temperatures over the past two millennia that is neither reported nor discussed by IPCC (or PAGES 2019).

To be clear, some of the technical articles on 30-60S ocean core proxies by specialist authors are truly excellent and far more magisterial than the IPCC mustered, in particular, several articles on offshore Chile. Here are a few:

Mohtadi et al, 2007. Cooling of the southern high latitudes during the Medieval Period
and its effect on ENSO link

Killian and Lamy 2012. A review of Glacial and Holocene paleoclimate records from southernmost Patagonia (49-55degS) link

Collins et al 2019. Centennial‐Scale SE Pacific Sea Surface Temperature Variability Over the Past 2,300 Years link

Just How Accurate Are Weather And Climate Measurements?

by Dr J. Lehr & T. Ciccone, Jan 5, 2021 in ClimateChangeDispatch


The accuracy and integrity of weather and climate measurements have always been a concern. However, errors and omissions were not as consequential in the past as they are now.

A hundred or even fifty years ago, our major weather concerns were more limited to local weather. When we have a flight from NYC to LAX, we need to know more detailed and reliable weather information, like is it snowing in St. Louis where we have a layover?

Or the farmer in Nebraska who needs to see the spring wheat production forecast in Ukraine. He needs the best possible information to better estimate the number of acres of winter wheat he should plant for today’s global markets.

We especially need better and more reliable information to decide what actions we should consider preparing for climate changes.

While scientists, engineers, and software programmers know the importance and the need for this data accuracy, the general public is not aware of how challenging these tasks can be.

When looking at long term climate data, we may have to use multiple proxies (indirect measures that we hope vary directly with weather), which add an extra layer of complexities, costs, and sources of error.

One of the most commonly used proxies is the ancient temperature and CO2 levels from ice core samples. Also, for the last few hundred years, tree-ring data was a primary source of annual temperatures.

A “Good” Proxy on the Antarctic Peninsula?

by Steve McIntyre, June 30, 2014 in ClimateAudit


Nearly all of the text of this article on an interesting ice core proxy series (James Ross Island) from the Antarctic Peninsula was written in June 2014, but not finished at the time for reasons that I don’t recall.  This proxy was one of 16 proxy series in the Kaufman 12K pdf. 60-90S reconstruction.

I originally drafted the article because it seemed to me that the then new James Ross Island isotope series exemplified many features of a “good” proxy according to ex ante criteria that I had loosely formulated from time to time in critiquing “bad” proxies, but never really codified (in large part, because it’s not easy to codify criteria except through handling data.)

Although this series is in the Kaufman 60-90S reconstruction, its appearance is quite different than the final 60-90S reconstruction: indeed, it has a very negative correlation (-0.61) to Kaufman’s final CPS reconstruction. I’ll discuss that in a different article.

Following is mostly 2014 notes, with some minot updating for context.

“Good” Proxies
I’ve articulated with increasing clarity over the years (but present in early work as well) – is that one needs to work outward from proxies that are “good” according to some ex ante criteria, rather than place hope in a complicated multivariate algorithm on inconsistent and noisy data, not all of which are “proxies” for the item being reconstructed. This is based on principles that I’ve observed in use by geophysicists and geologists to combine “good” (high resolution) data with lower quality data.

Hockey Stick Groundhog Day

by P. Homewood, August, 1, 2019 in NotaLotofPeopleKnowThat


Some ancient history

Fifteen to twenty years ago, Michael Mann and colleagues wrote a few papers claiming that current warming was unprecedented over the last 600 to 2000 years.  Other climate scientists described Mann’s work variously as crap, pathetic, sloppy, and crap.  These papers caught the interest of Stephen McIntyre and this led to the creation of his Climate Audit blog and the publication of paperspointing out the flaws in these hockey stick reconstructions. In particular, Mcintyre and his co-author Ross McKitrick showed that the method used by Mann and colleagues shifted the data in such a way that any data sets that showed an upward trend in the 20th century would receive a stronger weighting in the final reconstruction.  With this method, generation of a hockey-stick shape in the temperature reconstruction was virtually guaranteed, which M&M demonstrated by feeding in random numbers to the method.

Réchauffement climatique : le CO2 atmosphérique n’a pas toujours été le coupable

by Alex Barral et al., 2017 (U. Lyon-CNRS)


La comparaison des fluctuations du CO2 atmosphérique retracées à partir de ces estimations avec des courbes des changements de température a révélé de fortes baisses du CO2 atmosphérique (200-300 ppm), couplées à de fortes hausses de la température moyenne à la surface du globe (5-8°C) à l’échelle de quelques millions d’années.

Warm periods in the 20th century are not unprecedented during the last 2,000 years

by Prof. Quansheng Ge, August 8, 2017 in ClimateChangeDispatch


Prof. Quansheng Ge and his group from the Institute of Geographic Sciences and Natural Resources Research, Chinese Academy of Sciences, collected a large number of proxies and reconstructed a 2000-year temperature series in China with a 10-year resolution, enabling them to quantitatively reveal the characteristics of temperature change in China over a common era.

See also here

The 2400-year Bray cycle

by Javier, July 11, 2017 in ClimatEtc.


In our attempt to better understand the nature of our planet’s abrupt climate changes I have already reviewed the glacial-interglacial cycle, and the Dansgaard-Oeschger cycle’s that take place during glacial periods. I now start reviewing the millennial climate cycles that abruptly impact the slowly changing Holocene climate. The most significant and regular one is the ~ 2400-year Bray cycle.