Archives par mot-clé : Radiation

In Search Of A (Near) Perfect CO2 Global Warming Analogy

by R. Barmby, Jan 23; 2023 in ClimateChangeDispatch


Most people have a firm opinion on whether human emissions of carbon dioxide (CO2) are causing unnatural global warming, and hold that opinion without understanding how the molecule physically absorbs and then releases heat energy.

Understanding that mechanism reveals why today’s significant global CO2 emissions are insignificant to future global warming.

Analogies are a great way to explain science, and I’m going to share the worst and best analogies for how carbon dioxide acts as a greenhouse gas. I will also share why the warming effect of CO2 is limited.

Why Today’s Carbon Dioxide Emissions Are Insignificant To Global Warming

As more CO2 molecules are added as potential absorbers for the fixed amount of the specific band of infrared radiation, there is less chance that any CO2 molecule will be hit. If the additional CO2 molecules do not absorb infrared radiation, they cannot contribute to global warming.

The ever-reducing CO2 contribution to global warming looks like this graph, which, ironically, is based on the IPCC’s formula (from Inconvenient Facts by Gregory Wrightstone):

On the graph above, consider that the pre-industrial (circa 1875) atmospheric CO2 level was about 280 parts per million (ppm), and today it is about 420 ppm—an increase of 140 ppm.

As a rough approximation, the three bars labeled 350, 400, and 450 ppm represent this past increase in CO2, and the sum of the global warming temperature increases associated with those three bars is about 0.7°C.

The next four bars (500, 550, 600, and 650 ppm) represent a future CO2 increase of 200 ppm, which at today’s rate of 2.5 ppm increase each year would take from now to about 2100.

The global warming associated with those four bars is only 0.65°C. The graph shows it keeps taking more CO2 to achieve a smaller amount of global warming.

I chose bars 350 through 650 ppm to highlight that the IPCC’s formula predicts that global warming from current CO2 emissions held flat (1.35°C) would still beat the IPCC’s target of 1.5°C of human-caused global warming from preindustrial times to the year 2100.

The above graph suggests global warming from increasing CO2 never stops, but we know from ancient climates that even 12 times today’s CO2 concentrations did not cause runaway global warming.

Drs. Happer, Koonin, and Lindzen submitted to the U.S. (Northern California) District Court in 2021 that minor changes in cloud cover and convection currents can have a bigger effect on the Earth’s surface temperature than major increases in CO2.

Scientists: The Global Warming Since 1985 Cannot Be Attributed To CO2 Forcing

by K. Richard, Aug 8, 2022 in NoTricksZone


Cloud modulation of shortwave radiation and greenhouse effect forcing has largely been the determining factor in the global warming of the last 45 years. Not CO2.

CO2 forcing and its effect on surface temperatures is detailed in analyses of changes in clear-sky radiation only because all-sky radiation effects that include clouds (and the real-world atmosphere has clouds) overshadow the CO2 impact (Feldman et al., 2015, Harries et al., 2001).

Late 20th Century Climate Forcing

Per satellite observations, from 1985 to 1998 the “background clear-sky OLR [outgoing longwave radiation] was essentially unchanged” (Wang et al., 2002). In other words, any variations in OLR attributed to changes in greenhouse gas concentrations were not detectable.

In contrast, cloud vertical distributions explained 40% of increased tropical outgoing longwave radiation (OLR) and 60% could be explained by the emissivity of clouds, which means OLR changes were “most likely due entirely to changes in tropical cloud characteristics” and “cannot be attributed to increases in greenhouse gas concentrations.”

Furthermore, there was a decrease in reflected shortwave radiation (RSR) of -2.4 W/m² per decade observed from 1985 to 1999, which means there was a +3.6 W/m² increase in solar radiation absorbed by the Earth system during these 14 years. This can easily explain the warming during this period.

..

Physicists: Climate Model Error Overestimates CO2 Impact On Global Temps By Factor Of 5

by K. Richard, Nov 22, 2021 in NoTricksZone


A new study suggests CO2 molecules have little consequential impact affecting outgoing radiation, and that climate models attribute global temperature effects to CO2 that are fundamentally erroneous.

Russian physicists (Smirnov and Zhilyaev, 2021) have published a peer-reviewed paper in the Advances in Fundamental Physics Special Issue for the journal Foundations.

They assesses the role of CO2 molecules in the standard atmosphere and assert “we have a contradiction with the results of climatological models in the analysis of the Earth’s greenhouse effect.”

Key points from the paper include the following:

1. Climate model calculations of CO2’s impact on global temperatures are in error by a factor of 5 as a result of “ignoring, in climatological models, the Kirchhoff law” which says radiators are “simultaneously the absorbers.”

2. Change in the concentration of an optically active atmospheric component (like CO2) “would not lead to change in the outgoing radiative flux.”

3. CO2 molecules “are not the main radiator of the atmosphere.” Water vapor molecules are, and thus they “may be responsible for the observed heating of the Earth.”

Sun spotless for 33 days straight – airline travelers getting dosed with up to 70 times more radiation

by A. Watts, June 21, 2019 in WUWT


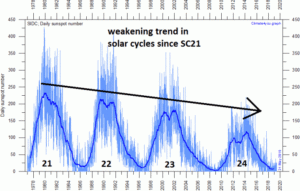
Are we in a solar grand minimum? We’ve seen this before, but now predictions are for an extremely weak solar cycle ahead.

Today is the summer solstice in the northern hemisphere. The sun has been without a single observable sunspot now for over a month – 33 days according to NOAA and SIDC data.


Daily observations of the number of sunspots since 1 January 1977 according to Solar Influences Data Analysis Center (SIDC). The thin blue line indicates the daily sunspot number, while the dark blue line indicates the running annual average. The recent low sunspot activity is clearly reflected in the recent low values for the total solar irradiance. Compare also with the geomagnetic Ap-index. Data source: WDC-SILSO, Royal Observatory of Belgium, Brussels. Last day shown: 31 May 2019. Last diagram update: 1 June 2019 . [Courtesy climate4you.com]

..

A Second Look At Radiation Versus Temperature

by Willis Eschenbach, June 14, 2019 in WUWT


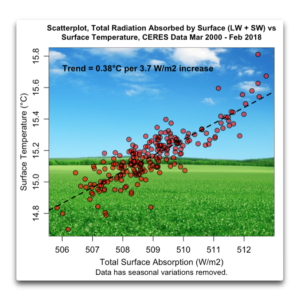
I kept going back and looking at the graphic from my previous post on radiation and temperature. It kept niggling at me. It shows the change in surface temperature compared to the contemporaneous change in how much energy the surface is absorbing. Here’s that graphic again:


Figure 1. From my previous post. It is a scatterplot showing the dependence of temperature on the total downwelling radiation (longwave plus shortwave) absorbed by the surface.

What I found botheracious were the outliers at the top of the diagram. I knew what they were from, which was the El Nino/La Nina of 2015-2016.

After thinking about that, I realized I’d left one factor out of the calculations above. What the El Nino phenomenon does is to periodically pump billions of cubic meters of the warmest Pacific equatorial water towards the poles. And I’d left that advected energy transfer out of the equation in Figure 1. (Horizontal transfer of energy from one place on earth to another is called “advection”).

And it’s not just advection of energy caused by El Nino. In general, heat is advected from the tropics towards the poles by the action of the ocean and the atmosphere. Figure 2 shows the average amount of energy exported (plus) or imported (minus) around the globe.

Radiation versus Temperature

by Willis Eschenbach, June 8, 2019 in WUWT


Due to the recent posts by Lord Monkton and Nick Stokes, I’ve been thinking about the relationship between radiation and temperature. So I turned to the CERES dataset. Here is a scatterplot of the monthly global average surface temperature versus the monthly global average downwelling total radiation absorbed by the surface. The total radiation is the sum of the net solar radiation at the surface and the downwelling longwave radiation at the surface. I’ve removed the seasonal variations from the data.

Note that 3.7 W/m2 is the increase in downwelling longwave radiation expected from a doubling of CO2 …

When I saw that, I thought well, maybe the increase is small because there’s a lag between the absorption of the radiation and the warming. To see if that was the case, I did a cross-correlation analysis of the relationship.