by Kip Hansen, November 30, 2019 in WUWT
…
…
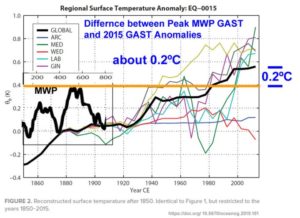
Now an annotated version of the second graph:
Here we have the second graph 1850-2015, with the global Average Surface Temperature anomaly (again — baseline 15 CE) but I have dropped in a smaller window, on the left, bringing forward the Roman Warm Period and the Medieval Warm Period (MWP) — the years 100-800 CE (same scale) — to illustrate the difference between the peak Global Average Surface Temperature (GAST) of the Medieval Warm Period to the most current GAST on the graph (2015).
This exposes the ubiquitous trick of the Climate Debate, in which Global Temperatures are [almost] always shown only from the depths of the Little Ice Age (clearly marked on the first graph by Gebbie), resulting in images similar to Gebbie’s Figure 2 — despite the fact that most 2 millennia reconstructions clearly show the Roman and Medieval Warm Periods as generally in the same range as the Modern Warm Period. Given the acknowledged range of error in any temperature reconstruction and in modern estimates of global surface temperatures (today, in absolute temperatrures, around +/- 0.5ºC or a range of 1ºC) — there may be little, if any, significant-to-the-global-environment difference between the two periods.
The Medieval Warm period did not result in a “Climate Catastrophe” and the [iffy] little additional 0.2°C seen today is very unlikely to spark a modern Climate Catastrophe either.