Archives par mot-clé : Warming

New Study: East Antarctica Was Up To 6°C Warmer Than Today During The Medieval Warm Period

by K. Richard, Oct 15, 2020 in NoTricksZone


As recently as 2000 to 1000 years ago, spanning the Roman to Medieval Warm Periods, East Antarctica was 5-6°C warmer than it is today. The consequent ice melt resulted in >60 meters higher water levels in East Antarctica’s lakes.

East Antarctica has been rapidly cooling in recent decades, with magnitudes reaching -0.7°C to -2.0°C per decade since the mid-1980s (Obryk et al., 2020).

A new study (Myers et al., 2020) reports that until about 15,000 years ago and throughout the Last Glacial Maximum, East Antarctica was 4-9°C colder than it is today.

Antarctica then abruptly warmed 15°C within centuries. From 12,000 to 6,000 years before present, East Antarctica was about 5°C warmer than it is today.

New confirmation that climate models overstate atmospheric warming

by Dr. Judith Curry, August 27, 2020 in WUWT


Reposted from Dr. Judith Curry’s Climate Etc.

Posted on August 25, 2020

by Ross McKitrick

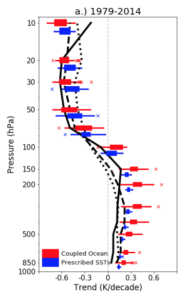
Two new peer-reviewed papers from independent teams confirm that climate models overstate atmospheric warming and the problem has gotten worse over time, not better.

The papers are Mitchell et al. (2020) “The vertical profile of recent tropical temperature trends: Persistent model biases in the context of internal variability” Environmental Research Letters, and McKitrick and Christy (2020) “Pervasive warming bias in CMIP6 tropospheric layers” Earth and Space Science. John and I didn’t know about the Mitchell team’s work until after their paper came out, and they likewise didn’t know about ours.

Mitchell et al. look at the surface, troposphere and stratosphere over the tropics (20N to 20S). John and I look at the tropical and global lower- and mid- troposphere. Both papers test large samples of the latest generation (“Coupled Model Intercomparison Project version 6” or CMIP6) climate models, i.e. the ones being used for the next IPCC report, and compare model outputs to post-1979 observations. John and I were able to examine 38 models while Mitchell et al. looked at 48 models. The sheer number makes one wonder why so many are needed, if the science is settled. Both papers looked at “hindcasts,” which are reconstructions of recent historical temperatures in response to observed greenhouse gas emissions and other changes (e.g. aerosols and solar forcing). Across the two papers it emerges that the models overshoot historical warming from the near-surface through the upper troposphere, in the tropics and globally.

Mitchell et al. 2020

Mitchell et al. had, in an earlier study, examined whether the problem is that the models amplify surface warming too much as you go up in altitude, or whether they get the vertical amplification right but start with too much surface warming. The short answer is both.

CLAIM: 100 degrees in Siberia? 5 ways the extreme Arctic heat wave follows a disturbing pattern

by C. Rotter, June 28, 2020 in WUWT


This essay from director of NSIDC, Mark Serreze, is provided for reference. You may remember Serreze who once said “the Arctic is screaming” while botching and then backpedaling on claims of “ice free summers” on the near horizon for the Arctic that never happened. Give it all the consideration it is due. For some perspective, see my article on a previous 100 degree event above the Arctic circle over 100 years ago. By the way, with 24 hours daylight above the Arctic circle, and near 24 hour daylight in Siberia this time of year, (the first day of summer aka  the summer solstice) is it any surprise it would get warm?

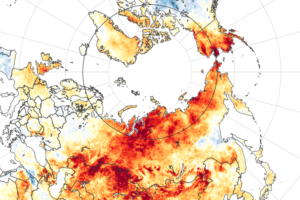
This Arctic heat wave has been unusually long-lived. The darkest reds on this map of the Arctic are areas that were more than 14 degrees Fahrenheit warmer in the spring of 2020 compared to the recent 15-year average. Joshua Stevens/NASA Earth Observatory

CMIP6 Climate Models Show 50% More Warming Than Observations Since 1979

by Roy W. Spencer, June 26, 2020 in ClimateChangeDispatch


Those who defend climate model predictions often produce plots of observed surface temperature compared to the models which show very good agreement.

Setting aside the debate over the continuing adjustments to the surface temperature record which produce ever-increasing warming trends, let’s look at how the most recent (CMIP6) models are doing compared to the latest version of the observations (however good those are).

First, I’d like to explain how some authors get such good agreement between the models and observations. Here are the two “techniques” they use that most annoy me.

  1. They look at long periods of time, say the last 100+ years. This improves the apparent agreement because most of that period was before there was substantial forcing of the climate system by increasing CO2.
  2. They plot anomalies about a common reference period but do not show trend lines. Or, if they show trend lines, they do not start them at the same point at the beginning of the record. When you do this, the discrepancy between models and observations is split in half, with the discrepancy in the latter half of the record having the opposite sign of the discrepancy in the early part of the record. They say, “See? The observed temperatures in the last few decades nearly match the models!”

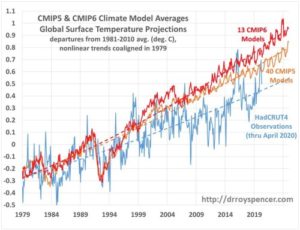
In the following plot (which will be included in a report I am doing for the Global Warming Policy Foundation) I avoid both of those problems.

During the period of strongest greenhouse gas forcing (since 1979), the latest CMIP6 models reveal 50% more net surface warming from 1979 up to April 2020 (+1.08 deg. C) than do the observations (+0.72 deg. C).


Continuer la lecture de CMIP6 Climate Models Show 50% More Warming Than Observations Since 1979

Scientists Panic, Because Arctic Is 0.4F Warmer Than In 1915!

by P. Homewood, June 21, 2020 in NotaLotofPeopleKnowThat


The Arctic is thought to have recorded its hottest ever temperature of 100.4F (38C) in Siberia, an astonishing 32F (18C) above the normal level for this time of year.

The mercury shot up to the unprecedented level in Verkhoyansk, 3,000 miles east of Moscow, as the region endures a summer heatwave.

Scientists had predicted the Arctic wouldn’t reach these levels until 2100, meaning it is warming 80 years faster than previously thought.

If the record is confirmed it will represent a new high. The current record for hottest temperature in the Arctic is held by Prospect Creek, Alaska, which recorded 100F (38C) in 1915.

Weatherman for CBS, Jeff Beradelli, said on Twitter yesterday: ‘Likely the hottest temperature ever recorded in the Arctic happened today.

‘What’s happening in Siberia this year is nothing short of remarkable. For perspective, Miami has only reached 100F (38C) once on record.’

https://www.dailymail.co.uk/news/article-8444319/Arctic-records-hottest-temperature-mercury-hits-100F-town-Verkhoyansk-Siberia.html?login#readerCommentsCommand-message-field


Even the babies who write for the Mail could surely spot the fly in the ointment – that this new record is only 0.4F higher than the previous one set in 1915! Hardly the apocalypse they are trying to present.

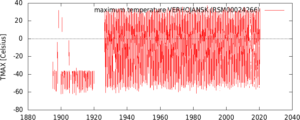
As for Verkhoyansk itself, temperatures there reached 37.3C (99.1F) in 1988 during a succession of 30C+ days, so again there is nothing remarkable about the latest weather at all :

New Studies Show Cloud Cover Changes Have Driven Greenland Warming And Ice Melt Trends Since The 1990s

by K. Richard, April 20, 2020 in NoTricksZone


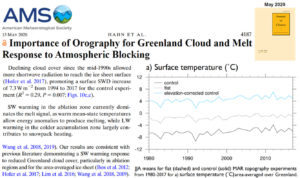
Scientists now acknowledge cloud cover changes “control the Earth’s hydrological cycle”, “regulate the Earth’s climate”, and “dominate the melt signal” for the Greenland ice sheet via modulation of absorbed shortwave radiation.  CO2 goes unmentioned as a contributing factor.


Extra warm U.S. winter had nature’s thumbprint on it–Joe Bastardi

by P. Homewood, April 3; 2020 in NotaLotofPeoppleKnowThat


Joe Bastardi explains why this winter has been so mild in the US, but also across N Europe, at CFACT.
Two points:

1) I will make the case for why such winters like this happen

2) I will point out that nowhere in this article did the massive natural physical drivers that far outweigh the effect of CO2, which is only .041% of the atmosphere. Pointedly, of which man is only responsible for  25% and the US only 15% of that total.

I am not going to waste time attacking here, except to say this kind of one-sided journalism and the fact that nowhere did anyone show what I am about to reveal to you, should raise questions of any objective person.

Basically the rules of the game are, if its warm like this winter, its climate change, if it is cold, its climate change. It is typical of everyone gets a trophy in that any answer even if opposite, means you get credit.

I won’t copy the whole article as it is a bit technical, but it can be seen here. However these are the main points Joe raises, starting with the role of El Nino and water vapour:

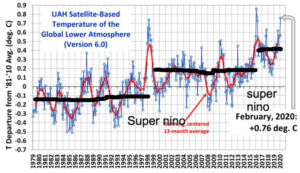
Water vapor is by far the most important greenhouse gas when it comes to the planetary weather and climate. Meteorologist look at “saturation mixing ratios” which show a correlation of water vapor to temperature. Basically the colder and drier the air mass, the more the introduction of water vapor will lead higher temperatures, there is no place like the arctic to prove this is the case. The cyclically warmed oceans have put more water vapor (and CO2) into the air. When Super El Niño’s go off, the immense amounts dispersed lead to a step up of the temperature. The colder regions leading the way as will be opined on below.

NOAA Relies on ‘Russian Collusion’ to Claim January Was Hottest Month on Record

by Anthony Watts, February 29, 2020 in WUWT


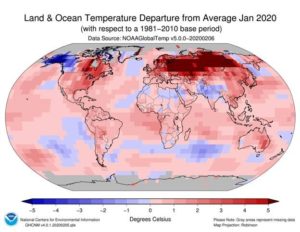
In a report generating substantial media attention this month, the National Oceanic and Atmospheric Administration (NOAA) claimed January 2020 was the hottest January on record. In reality, the claim relies on substantial speculation, dubious reporting methods, and a large, very suspicious, extremely warm reported heat patch covering most of Russia.

The January 2020 Climate Assessment Report, released by NOAA’s National Center for Environmental Information (NCEI), was accompanied by a map showing a giant red menace of extraordinary asserted warmth extending from the Russian border with Poland well into Siberia. Yet, the asserted hot spot appears nowhere else.


Figure 1: Map of temperature departure provided by NOAA/NCEII. Note the huge red spot over Russia.

Continuer la lecture de NOAA Relies on ‘Russian Collusion’ to Claim January Was Hottest Month on Record

Finally! The missing link between exploding stars, clouds and climate on Earth

by Shaviv, December  19, 2017 in ScieneBits/fromNature


By Henrik Svensmark and Nir shaviv

Our new results published today in nature communications provide the last piece of a long studied puzzle. We finally found the actual physical mechanism linking between atmospheric ionization and the formation of cloud condensation nuclei. Thus, we now understand the complete physical picture linking solar activity and our galactic environment (which govern the flux of cosmic rays ionizing the atmosphere) to climate here on Earth though changes in the cloud characteristics. In short, as small aerosols grow to become cloud condensation nuclei, they grow faster under higher background ionization rates. Consequently, they have a higher chance of surviving the growth without being eaten by larger aerosols. This effect was calculated theoretically and measured in a specially designed experiment conducted at the Danish Space Research Institute at the Danish Technical University, together with our colleagues Martin Andreas Bødker Enghoff and Jacob Svensmark.

Background:

It has long been known that solar variations appear to have a large effect on climate. This was already suggested by William Herschel over 200 years ago. Over the past several decades, more empirical evidence have unequivocally demonstrated the existence of such a link, as exemplified in the examples in the box below.

Climatologist: Climate Models Are Predicting Too Much Warming

by Dr. Benny Peiser, May 23, 2019 in GWPF


A leading climatologist has said that the computer simulations that are used to predict global warming are failing on a key measure of the climate today and cannot be trusted.

Speaking to a meeting in the Palace of Westminster in London, Professor John Christy of the University of Alabama in Huntsville told MPs and peers that almost all climate models have predicted rapid warming at high altitudes in the tropics:

A paper outlining Dr. Christy’s key findings is published today by the Global Warming Policy Foundation.

CBC Claims Canada Warming Twice As Fast As Globe, Yet Data Tell A Different Story: No Warming In 25 Years!

by P. Gosselin, April 3, 2019 in NoTricksZone


Canada’s CBC here recently cited “a leaked report” which claimed Canada is “warming at twice the global rate.”

According to the “leaked report”, Canada’s annual average temperature over land has warmed 1.7 C when looking at the data since 1948. But that claim is misleading when recent data is considered.

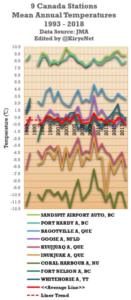
Over the past 25 years, since scientists began to warn that the planet was warming in earnest, there has not been any warming when one looks at the untampered data provided by the Japan meteorology Agency (JMA) that were measured by 9 different stations across Canada. These 9 stations have the data dating back to around 1983 or 1986, so I used their datasats.

Looking at the JMA database and plotting the stations with longer term recording, we have the following chart:

Le réchauffement climatique d’origine anthropique

by G. Geuskens, 14 février 2019, in ScienceClimatEnergie


Le climat peut changer, comme il l’a toujours fait et continuera à le faire sous l’action de variables naturelles. Les activités humaines peuvent-elles avoir une influence comme le prétend la théorie du réchauffement climatique d’origine anthropique ? Cette théorie est basée sur l’existence d’un hypothétique effet de serre défini comme un phénomène radiatifcausé par des gaz tels la vapeur d’eau ou le CO2 qui absorbent une fraction du rayonnement infrarouge émis par la Terre et le réémettent  ensuite dans toutes  les directions et notamment vers la surface terrestre dont la température serait, de ce fait, plus élevée qu’en l’absence de gaz absorbant l’infrarouge. L’effet de serre résulterait donc essentiellement de l’émission par les molécules de CO2 d’un rayonnement  de fluorescence  dans le domaine infrarouge [1]. Cette définition est claire et scientifiquement valable car conforme au principe de réfutabilité défini par Karl Popper. Nous l’examinerons à la lumière de théories physiques bien établies et de faits expérimentaux connus.

1. Le CO2 dans les basses couches atmosphériques

Solar Cycle 24 Going Down As Quietest In Almost 200 Years, May Put The Brakes On Warming

by Von Frank Bosse & F. Vahrenholt, January 30, 2019 in WUWT


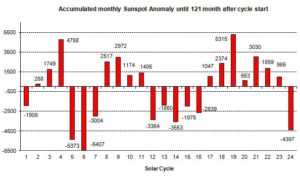
Our sun was also very sub-normally active in December last year. We are writing the 121st month since the beginning of cycle number 24, in December 2008, and since 2012 (when we started the blog here) we could only reformulate the opening sentence once: In September 2017 when the sun was 13% more active than the long-term (since 1755) average.

All other months were below average. With the sunspot number (SSN) of 3.1 for the monthly average for December and a total of 24 days without any spot (throughout the second half of the month the sun was spotless) we are in the middle of the cycle minimum.

Fig. 2: The sunspot activity of our sun since cycle 1 (1755). The numbers are calculated by adding the monthly differences with respect to the mean (blue in Fig.1) up to the current cycle month 121.

.

Ocean Warming in Climate Models Varies Far More than Recent Study Suggests

by Roy Spencer, January 17, 2019 in GlobalWarming


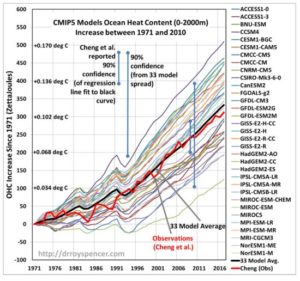
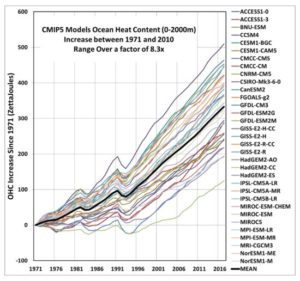
I wanted to expand upon something that was mentioned in yesterday’s blog post about the recent Cheng et al. paper which was widely reported with headlines suggesting a newer estimate of the rate of ocean warming is 40% higher than old estimates from the IPCC AR5 report in 2013. I demonstrated that the new dataset was only only 11% warmer when compared to the AR5 best estimate of ocean warming during 1971-2010.

The point I want to reemphasize today is the huge range in ocean warming between the 33 models included in that study. Here’s a plot based upon data from Cheng’s website which, for the period in question (1971-2010) shows a factor of 8 range between the model with the least ocean warming and the model with the most warming, based upon linear trends fitted to the model curves:

Yearly ocean heat content (OHC) changes since 1971 in 33 models versus the recent Cheng reanalysis of XBT and Argo ocean temperature data for the surface to 2,000m layer. The vertical scale is in both ZettaJoules (10^21 Joules) and in deg. C (assuming an ocean area of 3.6 x 10^14 m^2). The Cheng et al. confidence interval has been inflated by 1.43 to account for the difference between the surface area of the Earth (Cheng et al. usage) and the actual ocean surface area.

New Paper: PETM Was Caused by Climate Change… Ancient Climate Change Caused Climate Change… AEUHHH????

by David Middleton, January 23, 2019 in WUWT


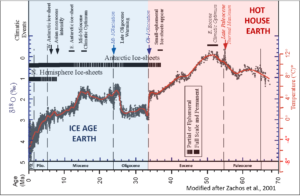
Note how the PETM (55 Ma) is about as far from a CO2 analog to modern times as it possibly could be… unless the PETM stomata data are correct, in which case AGW is even more insignificant than previously thought.

Regarding temperatures, the PETM is also about as far from being an analog to modern times as it possibly could be.


Figure 2.  High latitude SST (°C) From benthic foram δ18O.  Funny how the PETM is often cited as a nightmarish version of a real-world RCP8.5… While the warmer EECO is a climatic optimum. (Zachos et al., 2001). Note: Older is to the right.


Is ocean warming accelerating faster than thought? In a word, no.

by Nic Lewis, January 22, 2019 in WUWT


There are a number of statements in Cheng et al. (2019) ‘How fast are the oceans warming’, (‘the paper’) that appear to be mistaken and/or potentially misleading. My analysis of these issues is followed by a reply from the paper’s authors.

Contrary to what the paper indicates:

  • Contemporary estimates of the trend in 0–2000 m depth ocean heat content over 1971–2010 are closely in line with that assessed in the IPCC AR5 report five years ago

  • Contemporary estimates of the trend in 0–2000 m depth ocean heat content over 2005–2017 are significantly (> 95% probability) smaller than the mean CMIP5 model simulation trend.

Study Claiming Insect Decline Due To Global Warming Is Based On Faulty Temperature Data.

by P. Homewood, January 20, 2019 in NotaLotofPeople KnowThat


Clearly the whole study is worthless, and the paper should be withdrawn.

There are some alarming facts about all of this:

1) Why did the researchers not suspect that the temperature data looked hopelessly wrong at the outset?

2) Why did peer review not do the basic checks that I did?

3) The study carries out some mindbendingly complex statistical analysis, linking arthropod decline to rising temperatures. But how can this analysis have been robust, when the temperature data was hopelessly wrong?

The conclusion is that the faulty temperature data matched the researchers’ expectations of climate warming, and consequently they never bothered to crosscheck. It would after all have been extremely simple to have asked the people who maintain the data.

Whether or not arthropods are in decline I have no idea. But by blaming non existent climate warming, there is a very real danger that the true cause is being missed. Indeed, looking at those graphs, it may well be climate cooling that is responsible.

I plan to contact PNAS, who published the paper, to request that it be withdrawn.

Media Reports of +40% Adjustment in Ocean Warming Were Greatly Exaggerated

by Roy W. Spencer, Ph. D., January 16, 2019


Summary:The recently reported upward adjustment in the 1971-2010 Ocean Heat Content (OHC) increase compared to the last official estimate from the IPCC is actually 11%, not 40%. The 40% increase turns out to be relative to the average of various OHC estimates the IPCC addressed in their 2013 report, most of which were rejected. Curiously, the new estimate is almost identical to the average of 33 CMIP climate models, yet the models themselves range over a factor of 8 in their rates of ocean warming. Also curious is the warmth-enhancing nature of temperature adjustments over the years from surface thermometers, radiosondes, satellites, and now ocean heat content, with virtually all data adjustments leading to more warming rather than less.

See also here

MATH ERROR: Scientists Admit ‘Mistakes’ Led To Alarming Results In Major Global Warming Study

by M. Bastasch, November 14, 2018 in WUWT/DailyCaller


  • Scientists behind a headline-grabbing climate study admitted they “really muffed” their paper.

  • Their study claimed to find 60 percent more warming in the oceans, but that was based on math errors.

  • The errors were initially spotted by scientist Nic Lewis, who called them “serious (but surely inadvertent) errors.”

The scientists behind a headline-grabbing global warming study did something that seems all too rare these days — they admitted to making mistakes and thanked the researcher, a global warming skeptic, who pointed them out.

“When we were confronted with his insight it became immediately clear there was an issue there,” study co-author Ralph Keeling told The San Diego Union-Tribune on Tuesday.

Their study, published in October, used a new method of measuring ocean heat uptake and found the oceans had absorbed 60 more heat than previously thought. Many news outlets relayed the findings, but independent scientist Nic Lewis quickly found problems with the study.

Keeling, a scientist at the Scripps Institution of Oceanography, owned up to the mistake and thanked Lewis for finding it. Keeling and his co-authors submitted a correction to the journal Nature. (RELATED: Headline-Grabbing Global Warming Study Suffers From A Major Math Error)

Why CO2 Is Not A Climate Control Knob

by A. Bright-Paul, October 22, 2018 in ClimateChageDispatch


As the Earth rotates on its own axis, one-half of the Earth is cooling while the other half is warming up.

So the Earth is warming and cooling daily and the temperature is changing 3,600 times every hour in every location all over the world, as there are 3,600 seconds in every hour.

As the Earth is traveling around the Sun in an ellipse at 66,000 miles per hour and is tilted and wobbling as it spins, so the Earth has seasons, as the angle to the Sun varies.

So the temperatures in the spring and summer are usually warmer than in the autumn and winter when temperatures decline.

So there is a massive number of different temperatures over the whole Earth, constantly changing and always in flux.

Wide-scale US wind power could cause significant warming

by James Temple, October 4, 2018 in MITTechnologyReview


Wind power is booming in the United States.

It’s expanded 35-fold since 2000 and now provides 8% of the nation’s electricity. The US Department of Energy expects wind turbine capacity to more than quadruple again by 2050.

But a new study by a pair of Harvard researchers finds that a high amount of wind power could mean more climate warming, at least regionally and in the immediate decades ahead. The paper raises serious questions about just how much the United States or other nations should look to wind power to clean up electricity systems.

Highlights

  • Wind power reduces emissions while causing climatic impacts such as warmer temperatures
  • Warming effect strongest at night when temperatures increase with height
  • Nighttime warming effect observed at 28 operational US wind farms
  • Wind’s warming can exceed avoided warming from reduced emissions for a century