SPOTLIGHT: The event in which Jim Hansen put climate change on the media map has triggered hallucinations in high places.
BIG PICTURE: I’ve previously discussed how Timothy Wirth, who chaired an historic US senate committee hearing in 1988, has given two accounts of what happened prior to its commencement.
During a 2007 television interview, he jovially described taking measures to circumvent the air conditioning in the meeting room. Global warming was being discussed, and those in attendance were sweltering. After being challenged by a Washington Post fact checker in 2015, however, Wirth caved. In a written statement, he said the pre-hearing measures didn’t happen. Those were just rumours he’d heard. (…)
The discovery of the Durmid Ladder reveals the southern tip of the San Andreas Fault changes fairly gradually into the ladder-like Brawley Seismic zone. The structure trends northwest, extending from the well-known main trace of the San Andreas Fault along the Salton Sea’s northeastern shore, to the newly identified East Shoreline Fault Zone on the San Andreas’ opposite edge.
“We now have critical evidence about the possible nucleation site of the next major earthquake on the San Andreas Fault,” says Jänecke, professor in USU’s Department of Geology. “That possible nucleation site was thought to be a small area near Bombay Beach, California, but our work suggests there may be an additional, longer ‘fuse’ south of the Durmid Ladder within the 37-mile-long Brawley Seismic zone.” …
As readers of my posts know, I’ve held for many years that there are a variety of emergent phenomena that regulate the earth’s temperature. See my posts The Thermostat Hypothesisand Emergent Climate Phenomena for an overview of my hypothesis.
One of the predictions derivable from my hypothesis is that the earth should be relatively insensitive to small changes in forcing. According to my hypothesis, if the total energy entering the system changes in such a manner that the global temperatures start to drop, inter alia the system responds through changes in the time and strength of the daily emergence of the tropical cumulus field and the associated thunderstorms. This allows more sunlight to enter the system and decreases the thunderstorm-caused surface heat losses, balancing out the energy lost elsewhere and maintaining the temperature.
Some of the earliest complex organisms on Earth — possibly some of the earliest animals to exist — got big not to compete for food, but to spread their offspring as far as possible.
The research, led by the University of Cambridge, found that the most successful organisms living in the oceans more than half a billion years ago were the ones that were able to ‘throw’ their offspring the farthest, thereby colonising their surroundings. The results are reported in the journal Nature Ecology and Evolution.
Prior to the Ediacaran period, between 635 and 541 million years ago, life forms were microscopic in size, but during the Ediacaran, large, complex organisms first appeared, some of which — such as a type of organism known as rangeomorphs — grew as tall as two metres.
From the AGU and the “but, but, the continent is melting!” department.
COLDEST PLACE ON EARTH IS COLDER THAN SCIENTISTS THOUGHT
WASHINGTON — Tiny valleys near the top of Antarctica’s ice sheet reach temperatures of nearly minus 100 degrees Celsius (minus 148 degrees Fahrenheit) in the winter, a new study finds. The results could change scientists’ understanding of just how low temperatures can get at Earth’s surface, according to the researchers.
Scientists announced in 2013 they had found the lowest temperatures on Earth’s surface: Sensors on several Earth-observing satellites measured temperatures of minus 93 degrees Celsius (minus 135 degrees Fahrenheit) in several spots on the East Antarctic Plateau, a high snowy plateau in central Antarctica that encompasses the South Pole. But the researchers revised that initial study with new data and found the temperatures actually reach minus 98 degrees Celsius (minus 144 degrees Fahrenheit) during the southern polar night, mostly during July and August.
SPOTLIGHT: Competing accounts of an historic climate hearing.
BIG PICTURE: June 23rd, 1988 is considered the day the climate crusade hit the jackpot. Thirty years ago, a sea of television cameras recorded NASA’s James Hansen testifying before a US Senate committee.
The “greenhouse effect has been detected, and it is changing our climate now,” he said. There was “99 percent confidence” that human-caused global warming was underway.
The person chairing the committee was Democratic Senator Timothy Wirth. Nine years later, when interviewed by PBS’s Frontline, he cheerfully revealed that the date of the hearing had been specially chosen.
LM: I found this itemized list rather impressive even though it’s in no way complete. Whether we live in Thailand or Europe, we have been exposed to a very large amount of fearmongering and failed predictions. The explosion of these news in 2005-2010 is easily seen in the lists below. After 2010, the growth arguably stopped or reversed so this contribution may be considered the work by a historian. There’s a clean mobile version of this page.
Dr Peter Ridd has taken James Cook University to court protesting his sacking for what he says is, primarily, speaking-out about the lack of quality assurance in Great Barrier Reef science.
Dr Ridd spoke out initially about there being no quality assurance of Great Barrier Reef science – science that is arguably misused to secure billions of dollars of tax-payer funding. When the University tried to stop Dr Ridd doing this, Dr Ridd spoke out against University management – making all the documentation public including on his new website.
The Arctic and North Atlantic have suddenly turned surprisingly cold. First, according to Weatherbell meteorologist Joe Bastardi, the northern Atlantic has turned cold; so cold in fact that Bastardi called it “impressive”: …
All the Atlantic cold could have a big (positive) impact on the upcoming hurricane season, says hurricane expert Philip Klotzbach. One week ago Klotzbach tweeted …
Assuming that the uncertainty in GIA adjustments are ‘in the noise’ of global sea level rise may not be entirely justified. The adjustments to the satellite data that emerged in the discussion between Morner and Nerem do not inspire confidence in the estimate of sea level rise from satellite data, and the low level of stated uncertainty strains credulity.
Antarctic ice sheet is melting, but rising bedrock below could slow it down
An international team, led by DTU Space at the Technical University of Denmark with Colorado State University, has found that the bedrock below the remote West Antarctic Ice Sheet is rising much more rapidly than previously thought, in response to ongoing ice melt.
The study, “Observed rapid bedrock uplift in the Amundsen Sea Embayment promotes ice-sheet stability,” reveals new insights on the geology of the region and its interaction with the ice sheet and is published in the journal Science. The authors noted that the findings have important implications in understanding and predicting the stability of the ice sheet and Earth’s rising sea levels.
by P. Homewood, June 22, 2018 in NotaLotofPeopleKnowThat
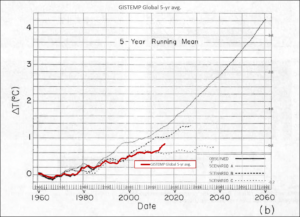
“Thirty years of data have been collected since Mr. Hansen outlined his scenarios—enough to determine which was closest to reality. And the winner is Scenario C. Global surface temperature has not increased significantly since 2000, discounting the larger-than-usual El Niño of 2015-16. Assessed by Mr. Hansen’s model, surface temperatures are behaving as if we had capped 18 years ago the carbon-dioxide emissions responsible for the enhanced greenhouse effect. But we didn’t. And it isn’t just Mr. Hansen who got it wrong. Models devised by the United Nations Intergovernmental Panel on Climate Change have, on average, predicted about twice as much warming as has been observed since global satellite temperature monitoring began 40 years ago…”
“Several more of Mr. Hansen’s predictions can now be judged by history. Have hurricanes gotten stronger, as Mr. Hansen predicted in a 2016 study? No. Satellite data from 1970 onward shows no evidence of this in relation to global surface temperature. Have storms caused increasing amounts of damage in the U.S.? Data from the National Oceanic and Atmospheric Administration show no such increase in damage, measured as a percentage of gross domestic product. How about stronger tornadoes? The opposite may be true, as NOAA data offers some evidence of a decline. The list of what didn’t happen is long and tedious.”
Energy access is the “golden thread” that weaves together economic growth, human development and environmental sustainability. The adoption of the Sustainable Development Goals in 2015, and the adoption of SDG 7.1 specifically – the goal to ensure access to affordable, reliable, and modern energy for all by 2030 – established a new level of political recognition for energy’s central role in development.
Improvements in technologies are offering new opportunities for making significant progress on the SDG goal on electricity access. The combination of declining costs for solar and decentralised solutions, cheaper and more efficient lighting and appliances, and new business models making use of digital, mobile-enabled platforms has increased the number of available solutions to cater to those currently without electricity access. But many challenges remain, particularly for clean cooking.
The main findings show that population growth and changes in our consumption patterns put unprecedented pressure on the planet’s natural resources:
Over 75% of the Earth’s land area is already degraded, and over 90% could become degraded by 2050.
Globally, a total area half of the size of the European Union (4.18 million km²) is degraded annually, with Africa and Asia being the most affected.
The economic cost of soil degradation for the EU is estimated to be in the order of tens of billions of euros annually.
Land degradation and climate change are estimated to lead to a reduction of global crop yields by about 10% by 2050. Most of this will occur in India, China and sub-Saharan Africa, where land degradation could halve crop production.
As a consequence of accelerated deforestation it will become more difficult to mitigate the effects of climate change
By 2050, up to 700 million people are estimated to have been displaced due to issues linked to scarce land resources. The figure could reach up to 10 billion by the end of this century.
Ce week-end, le monde de l’énergie délaissera le Mondial de football pour s’intéresser à la rencontre ministérielle de l’OPEP à Vienne. Des grandes manœuvres sont en cours, non pas tellement pour décider des « allocations de production » – pléonasme employé par l’OPEP pour ne pas parler de « quotas de production », ce qui aurait une connotation négative – mais des positionnements géopolitiques dans le nouveau monde en construction.
Flash-back. Au début des années 1970, dans la droite ligne du malthusianisme, le Club de Rome propage une nouvelle vague de peur en s’appuyant sur des craintes fournies par des ordinateurs : tout le monde a cru que la fin du pétrole annoncée pour 2000 était une vérité scientifique. À l’époque, la modélisation était innovante et donc attractive…
Sustainable alarm, unending hoax. Commentary at Germany’s ‘Die Welt’: Why has the climate-last-chance alarm been blaring 30 years long now? And why has the planet today “suddenly” just been given yet another 20 years by experts?
Remember how in 2007 Al Gore warned we had only 10 more years to act?
Well, those 10 years have long since expired, and that deadline came and went without the planet changing much. Embarrassed, global warming alarmists quietly pushed the doomsday back once again. And this time it was for real.
This game has been going on for years now.
Today, business journalist Daniel Wetzel here in a commentary at German national daily Die Welt finally is wondering why it’s been “5 to midnight for 30 years now”!
One of the most important numbers in the world goes by the catchy title of Equilibrium Climate Sensitivity, or ECS. It is a measure of how much the climate responds to greenhouse gases. More formally, it is defined as the increase, in degrees Celsius, of average temperatures around the world, after doubling the amount of carbon dioxide in the atmosphere and allowing the atmosphere and the oceans to adjust fully to the change. The reason it’s important is that it is the ultimate justification for governmental policies to fight climate change.
The United Nations Intergovernmental Panel on Climate Change (IPCC) says ECS is likely between 1.5 and 4.5 degrees Celsius, but it can’t be more precise than that. Which is too bad, because an enormous amount of public policy depends on its value. People who study the impacts of global warming have found that if ECS is low — say, less than two — then the impacts of global warming on the economy will be mostly small and, in many places, mildly beneficial.
From ARS Technica, one of the most incoherent things I’ve ever read…
…
The shocking thing is that Howard Lee has a degree in geology. The fact that he makes his living as an “Earth Science writer” and not as a geologist might just be relevant.
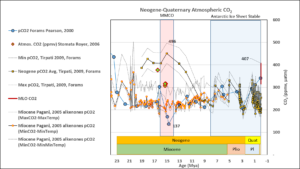
Can the Miocene tell our future? I’ll let Bubba’s mom answer that question:
Now it matters to do a better job understanding the ocean,” Resplandy said. “Our main point is that carbon gets re-distributed because it was wrongly allocated. A lot of people had different pieces, but all the pieces weren’t quite fitting together.”
Not a single EU state is meeting its climate targets, a new analysis by CAN Europe finds.
It’s been close to three years since countries worldwide signed the Paris Agreement, which obligates nations pledge to commit themselves to intending (or something like that) to reduce their greenhouse gas emissions in order to “safeguard the planet’s future”.
The language of the Agreement is in fact non-binding, and so one wouldn’t be surprised to learn that some signatories might not be living up to the agreement’s spirit.
Richard Siegmund Lindzen is an American atmospheric physicist known for his work in the dynamics of the atmosphere, atmospheric tides, and ozone photochemistry. He has published more than 200 scientific papers and books. From 1983 until his retirement in 2013, he was Alfred P. Sloan Professor of Meteorology at the Massachusetts Institute of Technology. He was a lead author of Chapter 7, “Physical Climate Processes and Feedbacks,” of the Intergovernmental Panel on Climate Change’s Third Assessment Report on climate change. He has criticized the scientific consensus about climate change and what he has called “climate alarmism.”
According to a new paper published in the Journal of Geophysical Research, the observed mean thickness of the sea ice in the region north of (Arctic) Svalbard was substantially thinner (0.94 m) in 1955 than it has been in recent years (~1.6 m, 2015/2017).
Another reason the Paris Accord is collapsing is because it’s not going to do anything we were promised it would.
When it comes to coal, Vahrenholt notes, so far only Europe and Canada have expressed some sort of a commitment to exit coal, and then he reminds us China, India and all developing countries will still be permitted to continue “massively” expanding their use of coal. He writes : (…)
La géologie, une science plus que passionnante … et diverse