by P. Homewood, April 1, 2018 in NotaLotofPeopleKnowThat
Lake Chad – a source of water to millions of people in West Africa – has shrunk by nine-tenths due to climate change, population growth and irrigation. But can a scheme dating back to the 1980s save it?
“It’s a ridiculous plan and it will never happen.” That’s the reaction many people have to the idea of trying to fill up Lake Chad and restore it to its former ocean-like glory by diverting water from the Congo river system 2,400km (1,500 miles) away.
Huffington Post has noticed that many university academics are utter climate hypocrites, that many of them rate their personal importance by how many professional air miles they can accumulate every year (…)
People have asked about the tools that I use to look for any signature of sunspot-related solar variations in climate datasets. They’ve wondered whether these tools are up to the task. What I use are periodograms and Complete Ensemble Empirical Mode Decomposition (CEEMD). Periodograms show how much strength there is at various cycle lengths (periods) in a given signal. CEEMD decomposes a signal into underlying simpler signals.
Now, a lot of folks seem to think that they can determine whether a climate dataset is related to the sunspot cycle simply by looking at a graph. So, here’s a test of that ability. Below is recent sunspot data, along with four datasets A, B, C, and D. The question is, which of the four datasets (if any) is affected by sunspots?
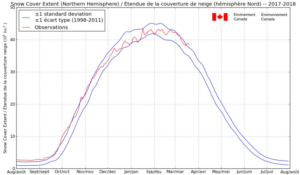
Although a number of scientists are hollering that 2017 was “among the warmest on record”, we are not seeing any manifestation of this, at least over the northern hemisphere, where ironically snow and ice have shown surprising extents. This year the northern hemisphere winter has been surprisingly cold and brutal over a number of regions.
On March 20, 2018, northern hemisphere snow and ice cover was over 1 standard deviation above normal. Source: Environment Canada.
A new 53 million-year-old insect fossil called a scorpionfly discovered at B.C.’s McAbee fossil bed site bears a striking resemblance to fossils of the same age from Pacific-coastal Russia, giving further evidence of an ancient Canada-Russia connection.
The thousands of metric tons of carbon dioxide (CO2) emitted from power plants each year doesn’t have to go into the atmosphere. Researchers are optimistic that within the next decade we will be able to affordably capture CO2 waste and convert it into useful molecules for feedstock, biofuels, pharmaceuticals, or renewable fuels. On March 29 in the journal Joule, a team of Canadian and US scientists describe their vision for what we should make with CO2 and how we can make it.
Steve McIntyre Spots ‘Several Errors’ Corrupting Arctic 2k; Some Are Corrected In 2014
Steve McIntyre, known for his evisceration of the questionable data-collection processes in the construction of “hockey stick” graphs, identified several suspicious “errors” corrupting the Arctic data set. He wrote about them on his blog.
by Nic Lewis, March 29, 2018 in ClimateAudit (Steve McIntyre)
The two strongest potentially credible constraints, and conclusions
In Part 1 of this article the nature and validity of emergent constraints[1] on equilibrium climate sensitivity (ECS) in GCMs were discussed, drawing mainly on the analysis and assessment of 19 such constraints in Caldwell et al. (2018),[2] who concluded that only four of them were credible. An extract of the rows of Table 1 of Part 1 detailing those four emergent constraints is given below.[3]
In the mid-1900’s many scientists were suggesting the Earth was cooling. Now scientists are forecasting global warming. Indeed, instrumental data shows global temperatures warmed by approximately 1-degree C during the past 165+ years. With warming rates of 0.5 to over 1.3 degrees C per century this has caused considerable alarm for many. This recent warming is commonly attributed to increasing greenhouse gases, primarily CO2.
This post examines natural paleoclimate trends and simple characteristics of past and present climate cycles at different time scales.
Little is known about the ice age human occupation of the Pacific Coast of Canada. Here we present the results of a targeted investigation of a late Pleistocene shoreline on Calvert Island, British Columbia. Drawing upon existing geomorphic information that sea level in the area was 2–3 m lower than present between 14,000 and 11,000 years ago, we began a systematic search for archaeological remains dating to this time period beneath intertidal beach sediments (…)
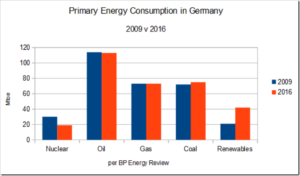
German CO2 equivalent emissions refuse to budge 10 straight years running, despite hundreds of BILLIONS invested in green energies.
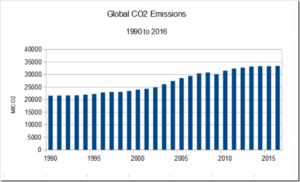
As we have been hearing recently, global CO2 emissions continue their steady climb, despite the trillions of dollars committed to green energy sources worldwide and efforts to curb CO2 emissions.
A new paper published by NASA by Tsigaridis and Kanakidou suggests that climate models have missed the forcing effects of organic aerosols, such as VOC’s from trees, oceans, and other sources that combine chemically in the atmosphere to create new compounds. Known as Secondary organic aerosols (SOA), they say “SOA forcing could exceed that of sulfate and black carbon”.
by Tony Heller, March 27, 2018 in CimateChangeDispatch
…
The key to understanding this can be found in the 2004 Smithsonian article. The Tuvalu story (like everything else with global warming) has always been about left-wing politics and money, not science.
But not all scientists agree that Tuvalu’s future is underwater. Some critics have branded island leaders as opportunists angling for foreign handouts and special recognition for would-be “environmental refugees” who, they say, are exploiting the crisis to gain entry to New Zealand and Australia. Others have even said that people and organizations sympathetic to Tuvalu are “eco-imperialists” intent on imposing their alarmist environmental views on the rest of the world.
And of course the same fake story in the Maldives, which were supposed to be underwater by 2018.
• We quantitatively analyse pre-eruptive intrusion-induced surface deformation from 33 scaled laboratory experiments resulting in eruptions.
• A robust proxy extracted from surface deformation geometry enables systematic predictions of the locations of a subsurface intrusion and imminent eruption.
• Forecasting an eruption location is possible without geodetic modeling but requires volcano monitoring at high spatiotemporal resolution.
Remember Paris? It was not even two years ago that the celebrated climate accords were signed — defining two degrees of global warming as a must-meet target and rallying all the world’s nations to meet it — and the returns are already dispiritingly grim.
This week, the International Energy Agency announced that carbon emissions grew 1.7 percent in 2017, after an ambiguous couple of years optimists hoped represented a leveling off, or peak; instead, we’re climbing again (…)
by Paul Homewood, March 27, 2018 in NotaLotofPeopleKnowThat
The GWPF has published its State of the Climate 2017 Report, written by Ole Humlum, former Professor of Physical Geography at the University Centre in Svalbard, Norway, and Emeritus Professor of Physical Geography, University of Oslo, Norway.
by Kelly Gilblom, March 26, 2018 in BloombergMarkets
Big Oil’s weight in equity indices to rise from 50-year low
Cost cuts, recovering oil prices put companies in a sweet spot
The world’s largest oil companies have survived a life-changing crisis, and are now poised to reap the rewards, Goldman Sachs Group Inc. said.
Big Oil is in a sweet spot with rising oil prices and low operating costs, leaving them with the biggest cash-flow growth in two decades and boosting earnings, Goldman said in a report Monday. That will increase their attraction for investors after years of elevated spending followed by crude’s slump sent their weighting in global equity indexes to a 50-year low, according to the bank (…)
by P. Homewood, March 2, 2018 in NotaLotofPeopleKnowThat
Everybody makes mistakes, and some of them matter. On the BBC’s News at Ten on the 18th January 2018 there were two of them, and the GWPF complained a few days later.
The first error was in describing the global temperature of 2017 as the “hottest year on record,” which it wasn’t.
The second mistake was that the BBC’s Environment Analyst Roger Harrabin said that, “2017 had no heating from El Nino,” which was also incorrect.
We pointed out that whilst 2017 was not designated a year in which there was an El Nino event (defined as a period with prolonged El Nino heating) there was in fact El Nino heating in the northern spring for 11 weeks, and we provided a graph to prove it. (Click on image to enlarge)(…)
“Le contenu de la mémoire est fonction de la vitesse de l’oubli”
Désormais, chaque inondation quelque peu catastrophique, chaque tornade, chaque anomalie météorologique est rattachée au réchauffement climatique qui parait-il nous menace, mais dont en plus l’homme serait responsable !
Pourtant, la consultation de chroniques ou récits anciens est révélatrice de précédents tout aussi apocalyptiques, et relativise la notion même de “changements climatiques”, ainsi que la définition d’un “climat stable” qui n’a jamais existé mais qu’on voudrait instaurer à tout prix.
A funny thing happens when you line up satellite and surface temperatures over Australia. A lot of the time they are very close, but some years the surface records from the Australian Bureau of Meteorology (BOM) are cooler by a full half a degree than the UAH satellite readings. Before anyone yells “adjustments”, this appears to be a real difference of instruments, but solving this mystery turns up a rather major flaw in climate models (…)
During 2017, there were 150 graphs from 122 scientific papers published in peer-reviewed journals indicating modern temperatures are not unprecedented, unusual, or hockey-stick-shaped — nor do they fall outside the range of natural variability.
We are less than 3 months into the new publication year. Already 46 new graphs from 40+ scientific papers undermine claims that modern era warming — or, in some regions, modern cooling — is climatically unusual.
Periods of extreme cold winter weather and perilous snowfall, similar to those that gripped the UK in a deep freeze with the arrival of the ‘Beast from the East’, could be linked to the solar cycle, pioneering new research has shown.
A new study, led by Dr Indrani Roy from the University of Exeter, has revealed when the solar cycle is in its ‘weaker’ phase, there are warm spells across the Arctic in winter, as well as heavy snowfall across the Eurasian sector.
by P. Homewood, March 23, 2018 in NotaLotofPeopleKnowThat
Global carbon dioxide emissions rose 1.4 percent in 2017 to a record-setting 32.5 gigatonnes, according to a report by the International Energy Agency (IEA).
Emissions rose after stalling for three years in a row, IEA reported. The Paris climate accord was signed by nearly 200 countries in 2015, which went into effect a year later. One year into the Paris accord, and emissions are on the rise.
IEA’s report echoes findings published by the Global Carbon Project late last year, predicting global emissions would rise 2 percent. The group projected emissions to rise again in 2018.
La géologie, une science plus que passionnante … et diverse