Global levels of ethane and propane in the atmosphere have been underestimated by more than 50%, new research involving scientists at the University of York has revealed.
These hydrocarbons are particularly harmful in large cities where, through chemical reactions with emissions from cars, they form ozone – a greenhouse gas which is a key component of smog and directly linked to increases in mortality.
Some recent studies show declines in average weights of polar bears compared to the 1980s, but none recorded an increase in the number of individuals starving to death or too thin to reproduce.14 Although some photos of starving bears have garnered media attention, most bears have been found to be in good-to-excellent condition. In fact, photos of fat bears seem to outnumber those of thin bears in recent years.
European Union nations are poised to endorse the biggest overhaul of the market they created more than a decade ago to rein in pollution, a move that may lift prices of power generated from fossil fuels.
The measures, due for final approval in Brussels on Tuesday, impose tougher requirements on thousands of companies to reduce greenhouse gases or pay higher costs for their carbon dioxide emissions. They’re part of a plan to clear up a flaw in the market that left the cost of CO2 permits well below the level needed to stir investments in green energy.
America has had its share of oil-centered energy problems and disruptions. Now it faces potential renewable energy and high technology crises, because of its heavy reliance on imports of the rare earth and other strategic minerals that are the essential building blocks for wind turbines, solar panels, computers, smart phones, medical diagnostic devices, night vision goggles, GPS and communication systems, long-life batteries and countless other applications.
“It blew our minds”… Of course it blew their minds. It always blows their minds when it’s not worse than previously expected. The climate science community probably has more blown minds per capita than UC Berkeley did in 1969.
by Alex Nussbaum, February 23, 2018 in BloombergNews
Cube development,’ which taps multiple layers of shale all at once, could accelerate the U.S. shale boom and make the global supply glut even worse.
In the scrublands of West Texas there’s an oil-drilling operation like few that have come before.
Encana Corp.’s RAB Davidson well pad is so mammoth, the explorer speaks of it in military terms, describing its efforts here as an occupation. More than 1 million pounds of drilling rigs, bulldozers, tanker trucks and other equipment spread out over a dusty 16-acre expanse. As of November, the 19 wells here collectively pumped almost 20,000 barrels of crude per day, according to company reports.
Firstly let me say that I am not one of the most technical writers you will see here. I regard myself pretty much as a layman despite studying Geology, Mathematics and Computer Science at University.
So you won’t find all the references to papers (well not many), nor exact scientific formulae. I simply write what I have logically deduced. For any who disagree, or have value to add, please use the Comments below.
Researchers have provided new insights into how molten rock (magma) moves through the Earth’s crust to feed volcanic eruptions. Using laboratory experiments involving water, jelly and laser imaging, researchers were able to demonstrate how magma magma flows through the Earth’s crust to the surface through magma-filled cracks called dykes.
How cities heat up The way streets and buildings are arranged makes a big difference in how heat builds up, study shows
CAMBRIDGE, Mass. – The arrangement of a city’s streets and buildings plays a crucial role in the local urban heat island effect, which causes cities to be hotter than their surroundings, researchers have found. The new finding could provide city planners and officials with new ways to influence those effects.
Some cities, such as New York and Chicago, are laid out on a precise grid, like the atoms in a crystal, while others such as Boston or London are arranged more chaotically, like the disordered atoms in a liquid or glass. The researchers found that the “crystalline” cities had a far greater buildup of heat compared to their surroundings than did the “glass-like” ones.
A vicious cold blast is about to invade Europe from the Russian Front and shock freeze the continent.
Interestingly some people – meteorologists among them – have been poking fun at the “hype” or even have blasted media outlets and other private meteorologists for “sensationalizing” the forecast Cold Beast from the East.
Sure, a number of locations over Germany for example may not even see temperatures drop below -10°C. What’s the big deal? It’s winter after all, they are saying. Just put on an extra coat. Some of these critics have even called the loud warnings of the Siberian cold “shrill, dumbass, click-baiting headlines“.
by Benny Peiser, February 23, 2018 in ClimateChangeDispatch
Ørsted must repair up to 2,000 wind turbine blades because the leading edge of the blades has become worn down after just a few years at sea.
Siemens Gamesa also does not want to comment on the costs, but the company’s Danish subsidiary has just provided 4.5 billion Danish Krone ($750 million) or 16% of its revenue to guarantee its commitments (…)
According to the United Nations Intergovernmental Panel on Climate Change (UN-IPCC) and computer modeling, the Sun’s role in modern-era climate change checks in at somewhere slightly above nothing.
And yet it is increasingly evident that more and more scientists across the globe do not take the position that the Sun’s influence on climate change is negligible.
In 2016 and 2017, for example, over 250 papers (see here and here) linking the Sun to climate changes were published in scientific journals.
by P. Homewood, February 22, 2018 in NotaLotofPeopleKnowThat
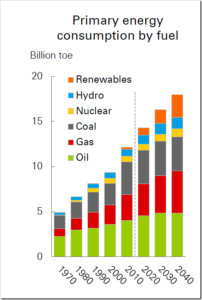
These are the highlights:
The speed of the energy transition is uncertain and the new Outlook considers a range of scenarios. Its evolving transition (ET) scenario, which assumes that government policies, technologies and societal preferences evolve in a manner and speed similar to the recent past, expects
The long term forecast for Europe, where it is already colder than normal, shows temperatures plummeting to near -20°C in parts of Central Europe by early next week, extending what has been already a brutal winter.
Europeans longing for spring will just have to be patient for awhile. Indeed this winter has been a harsh one across the northern hemisphere with record cold temperatures being set from Siberia to North America to Japan. Also a number of places have seen record snowfalls.
The European Alps have had one of the snowiest winters in years as snow continues to pile up meters high.
The bizarre issue of climate catastrophism has been around suf ciently long that it has become possible to trace its history in detail, and, indeed, several excellent re- cent books do this, placing the issue in the context of a variety of environmental, economic and political trends.
by P. Homewood, February 21, 2018 in NotaLotofPeopleKnowThat
The Arctic Ocean once froze reliably every year. Those days are over.
Arctic sea ice extent has been measured by satellites since the 1970s. And scientists can sample ice cores, permafrost records, and tree rings to make some assumptions about the sea ice extent going back 1,500 years. And when you put that all on a chart, well, it looks a little scary (…)
From the EUROPEAN COMMISSION JOINT RESEARCH CENTRE and the “Dr. Roger Pielke Sr. was right” department. I suspect a whole bunch of climate models that don’t take this into consideration, and think CO2 is the dominant climate driver, are going to need to be revised.
Land use change has warmed the Earth’s surface
Natural ecosystems play a crucial role in helping combat climate change, air pollution and soil erosion. A new study by a team of researchers from the Joint Research Centre, the European Commission’s science and knowledge service, sheds light on another, less well-known aspect of how these ecosystems, and forests in particular, can protect our planet against global warming.
by Bjorn Lomborg, February 20, 2018 in ClimateChangeDispatch
The world is mostly run on fossil fuels (81%). Nuclear makes up 5%, with 14% from renewables. Solar panels and wind turbines contribute 0.8%.
When you hear 14% renewables, you will likely think ‘wow, things are going pretty well with the switch to renewables’. But these renewables are not the ones you hear about. The biggest contributor is humanity’s oldest fuel: wood (…)
A new study on the timescale of plant evolution has concluded that the first plants to colonize the Earth originated around 500 million years ago — 100 million years earlier than previously thought.
For the first four billion years of Earth’s history, our planet’s continents would have been devoid of all life except microbes.
From Keele University and the “It’s like deja vu all over again” department with the leader of the “ship of fools” thrown in for comic relief. Long-time WUWT readers surely remember the single “Most influential tree in the world” from the Yamal fiasco, where the “signal” in one tree (YAD06) biased an entire paper with a hockey stick shape, making it worthless. Well, here we are again with another single tree used to define the entire globe. Obviously they’ve learned nothing, then again, it’s Chris Turney.
In popular culture, asteroids play the role of apocalyptic threat, get blamed for wiping out the dinosaurs — and offer an extraterrestrial source for mineral mining. But for one researcher, asteroids play an entirely different role: that of time capsules showing what molecules originally existed in our solar system. Having that information gives scientists the starting point they need to reconstruct the complex pathway that got life started on Earth.
Earlier this month, the authors of a new paper (Partridge et al., 2018) published in Geophysical Research Letters promulgated the term “warming hole” to describe the cooling temperatures gripping most of the Eastern half of the United States from the late 1950s through 2015
I missed this report at the time, but it is a comprehensive account of how large scale adjustments of temperatures have made global temperature datasets virtually worthless. (…)
by Eck, February 15, 2018 in K. Richard NoTricksZone
A new scientific study says surface temperatures in the Northeastern U.S. (Appalachian Mountains) have undergone a significant long-term cooling trend since the early 20th century, complicating the detection of a clear anthropogenic global warming (AGW) signal for the region.
According to Eck (2018), the two coldest Appalachian winters since 1910 were recorded in recent years (2009-’10 and 2010-’11), and 9 of the 10 warmest winters occurred prior to 1960.
In the early 1930s, Appalachian winters were 4.7°C warmer than they have been during the last 30 years (1987-2017).