Archives par mot-clé : UK

The Climate Scaremongers: More Lies From The UK’s Crackpot Climate Change Committee

by P. Homewood, May 09, 2025 in ClimateChangeDispatch 


The UK’s Climate Change Committee has warned the government that the country is heading for disaster unless it quickly ramps up efforts to tackle what it calls ‘climate risks’. [emphasis, links added]

In their latest Progress Report on Adaptation, they claim:

‘The increasing impacts of climate change are clear, both globally and in the UK. Adaptation is needed now to ensure that the UK is prepared for today’s extreme weather as well as the rapidly increasing severity of future risks. The costs of these impacts are already being felt, and the risks will continue to grow even if international targets to limit global warming are met. Action is needed now whilst we still have the opportunity to address these risks in a way that is both cost-effective and timely.’

They say that by 2050:

Over half of England’s prime farmland, one in four homes, and half of roads and rail lines will be at risk of flooding;

Heat-related deaths could pass 10,000 in an average year;

Unchecked climate change could cost 7 percent of GDP.

Absurd claims such as these, which have no basis in reality, show that the CCC is a body that we should not take seriously.

Their statement about floods ignores the reality that only a few thousand properties a year are affected by flooding, and there has been no upward trend in the numbers, according to official data from the Environment Agency.

The Hidden Cost Of Net Zero

by P. Homewood, May 8, 2025 in WUWT


UK Electricity Consumption

https://www.gov.uk/government/statistics/electricity-section-5-energy-trends

The REF’s new report on green energy subsidies noted that renewables subsidies are now costing £25.8 bn per year – or over £900 per household annually – about one third of which, £280, will hit the average domestic electricity bill directly.

For a long time, part of the gaslighting around the cost of Net Zero has been focus people’s attention over the impact on their energy bills.

However, as John Constable pointed out, only about a third of the cost hits the public directly via their electricity bills, because only a third of electricity is consumed by domestic users.

The other two thirds is used by industry and commerce, transport and the public sector.

But that does not mean that the public at large don’t end up footing the entire bill one way or another.

Higher electricity costs for industry and commerce mean higher prices in the shops. And higher electricity costs in the public sector mean higher taxes or poorer public services.

At the worst, businesses may shut or move their production abroad, leaving us all worse off.

Miliband and co would love you to think you are only paying a hundred quid or so for Net Zero. People would be horrified to learn that the price is nearer a thousand quid a year.

And that cost is of course just for starters. When we all have to buy expensive EVs and heat pumps we don’t want, we will be much worse off.

Met Office Try To Shut Down Debate On Junk Temperature Measurements

by P. Homewood, Jan 7, 2025 in NotaLotofPeopleKnowThat


hris Morrison has the latest on how the Met Office, in league with the green blob, are trying to shut down debate on the junk weather station scandal:

image

After a year of damaging revelations about the state of the Met Office’s temperature measuring network, the Green Blob-funded ‘fact-checker’ Science Feedback has sprung to the defence of the state-funded U.K. weather service. It has published a long ‘fact check’ seeking to exonerate practices that have recently come to light including the locating of stations with huge heat corrupted ‘uncertainties’ and the publication of invented data from 103 non-existent sites. Inept is a word that springs to mind. At one point, Science Feedback justifies the estimation of data at the non-existent stations by referring to the hastily changed Met Office explanation for station/location long-term averages. The original and now deleted Met Office webpage referenced station names and provided single location coordinates including one improbable siting next to the sea on Dover beach. This would appear to be a new low in the world of so-called fact-checking – designating copy as ‘misleading’ based on an explanation changed after the article was published.

Full story here.

England & Wales Rainfall Trends

by P. Homewood, Jan 8, 2025 in NotaLotofPeopleKnowThat


image

https://www.metoffice.gov.uk/hadobs/hadukp/data/monthly/HadEWP_monthly_totals.txt

It does not need me to tell you that it was quite wet last year. It was in fact ninth wettest in England & Wales since 1766, though nowhere near the two wettest years in 1872 and 1768.

For the last decade or so, we have been going through the same sort of weather as in the 1870s and 80s, as well as the 1920s.

But averages and trends are not particularly meaningful – nature does not do averages and straight lines! You could have ten years all with the same rainfall, or you could have five years with high rainfall and five years of drought, and you could get the same average.

If you just look at the distribution of wet years, there is no obvious pattern:

UK Temperatures In 2024

by P. Homewood, Jan 5, 2025 in NotaLotofPeopleKnowThat


UK annual temperatures have dropped for the second year running, though the Met Office will emphasise what they claim is a remorseless upwards trend. However they don’t show error margins in their graphs, and as we know, nine out of ten of the weather stations used for their UK temperature dataset are junk or near junk sites, where poor siting can mean temperatures may be overstated by as much as five degrees for Class 5 and two degrees for Class 4:

Research: “103 Of 302 Weather Stations In United Kingdom Do Not Exist At All!

by P. Homewood, Nov 27, 2024 in NoTricksZone


Paul Homewood wrote about poorly sited weather stations in Great Britain, thus making readings and climate data rather questionable.

The European Institute for Climate And Energy (EIKE) now reports of Great Britain’s phantom weather station network: one third of all its stations don’t actually exist. 

By Maurice Forgeng. Original article: Epoch Times here.

“All climate forecasts are based on more or less long-term documented measurements from weather stations. They can be used to determine past developments as well as possible trends in future local temperatures. Meteorologists also compile national and international trends based on the data from many measuring stations.”

“But what if much of this basic data is incorrect – or even made up? This is what journalist Ray Sanders claims about the measured values in the UK. According to his research, 103 of the 302 weather measuring stations in the United Kingdom do not exist at all. Nevertheless, they provide official data that is available to everyone on the website of the national weather authority.”

Sanders investigated the weather stations listed by the British Meteorological Service and found discrepancies in the data. For example, the Dungeness weather station supposedly on a nuclear power plant doesn’t exist. In fact, four out of eight stations in Kent do not exist  Also, coordinates for many stations are inaccurate.

Full report at EIKE

Tooting’s Great Storm Of 1914

by P. Homewood, June 14, in NotaLotofPeopleKnowThat


May be a black-and-white image of 3 people, street, Rijksmuseum and text that says "商聞 THEGREATSTOR STOR SuNe1t. SEELY ነ Joly"

May be an image of street and Rijksmuseum

May be a black-and-white image of street and text

110 years ago today, much of SW London was hit by what was called The Great Storm.

Tooting was hit with floods, as the above photos show, an event still remembered today.

The Met Office report for the month highlighted how much rain fell in such a short period over much of London. There was also extreme rainfall in other parts of the country.

Note also the serious railway accident in Inverness four days later.

What Heatwave?

by P. Homewood, Apr 14, 2024 in NotaLotOfPeopleKnowThat


I hope you did not blink, otherwise you may have missed it!

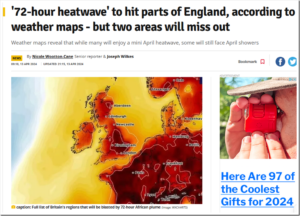
Brits are set to bask in a ’72 hour’ heatwave, according to some forecasters, but not everyone will be feeling the heat as two parts of England are expected to miss out on the sizzling temperatures.

Weather maps reveal that while many will enjoy a mini April heatwave, some will still face April showers. According to WX Charts, which uses Met Desk data for its predictions, temperatures could soar to a balmy 21C at times this month.

The charts indicate that Londoners can expect to enjoy highs of 20C from today until Saturday, with East Anglia and the East Midlands not far behind at 19C. Cities like Birmingham, Nottingham, Manchester, and Sheffield are also set to experience a warm 18C.

https://www.manchestereveningnews.co.uk/news/uk-news/72-hour-heatwave-hit-parts-28989573

Sure enough temperatures reached 21C in Essex, but I don’t know anyone who would actually describe this as a heatwave:

UK Rainfall In 2023

by P. Homewood, Jan 7 ,2024 in NotaLotofPeopleKonwThat


image

https://www.metoffice.gov.uk/hadobs/hadukp/data/monthly/HadEWP_monthly_totals.txt

Last year was a wet one in England & Wales, the 7th wettest on record. (The UK series has a similar result).

We routinely hear claims that the climate is wetter because a warmer atmosphere can hold more moisture, (while also being told we will get more droughts!). However the fact that we have had similarly wet years in the distant past, such as 1768, 1852, 1872, 1877, 1882, 1903 and 1960, rather demolishes that argument.

The major factor behind last year’s high rainfall was that the number of rain days was also one of the highest on record since 1931, when Met Office daily data begins. In short, annual rainfall was high because of weather, not climate.

CET Daily Temperatures

by P. Homewood, Jan 4, 2023 in NotaLotofPeople KnowThat


https://www.metoffice.gov.uk/hadobs/hadcet/cet_info_max2023.html

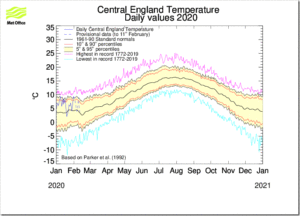
I want to focus on the end of year CET graph, which gives the lie to the extreme temperature myth often bandied around.

The graph plots daily max CET temperatures, against the background of the percentiles of the 1961-90 climatology. The Met Office should of course be using 1991-2020 as the baseline, so the climatology should be shifted upwards by a half a degree or so. But we’ll leave that aside.

We can legitimately regard anything between the 5% and 95% bands as being “weather”. Only days outside this might be regarded as “extreme”. (I would actually argue anything outside 1% and 99%).

We see that apart from a handful of days, every day was within that “normal weather” band.

In a year there will be 36 days outside of that band on average. The Met Office do not supply the data for these percentiles to enable the number of days to be calculated, but this year it does not look to be excessive in terms of that average.

Moreover, although there were a few days in September which set record highs for that particularly day, none were records for the month as a whole. The highest temperature last September was 28.9C, but the record for September stands at 31.5C in 1906:


Of course most of the year had temperatures above the average. But we have a wide range of weather in Britain. We can have mild, wet winters, and cold, snowy ones; we can have cool, wet summers and sunny hot ones. But these are weather events, not climate, and they are dependent on weather patterns, the jet stream and so on.

A predominance of warmer weather is not climate change.

CET 30-Year Averages

by P. Homewood, Sept 7, 2021 in NotaLotofPeopleKnowThat


The World Meteorological Organisation is clear about defining climate average:

image

It is disappointing then that the Met Office still continues to use the 1981-2010 period as its base. By doing this, of course, it exaggerates temperature increases in the UK.

If we look at the Central England Temperature mean temperatures, for example, we see that both winter and spring this year were colder than average, whilst summer was only 0.3C warmer:


….

Climate Crisis Update–England As Warm As 1736 Last Month!

by P. Homewood, February 13, 2020 in NotaLotofPeopleKnowThat


https://www.metoffice.gov.uk/hadobs/hadcet/cet_info_mean.html

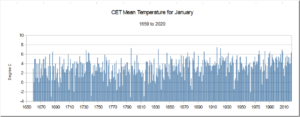
It’s been a mild start to the year here in England. In fact, according to the CET, it’s been the 14th warmest January since the start of records in 1659.

No doubt fingers will be pointed at global warming, but as the above chart shows, we have simply had mild weather of the commonly seen before. The difference is that it lasted virtually all month.

Moreover we have had warmer Januaries way back in the past. The warmest was in 1916, followed by 1921, 1796 and 1834.

https://www.metoffice.gov.uk/hadobs/hadcet/mly_cet_mean_sort.txt

Continuer la lecture de Climate Crisis Update–England As Warm As 1736 Last Month!

Gas needed for low-carbon targets says National Grid

by P. Homewood, April 8, 2018 in NotaLotofPeopleKnowThat


Bit by bit, some reality appears to be intruding into the make believe world of the Climate Change Act:

No credible scenario’ exists for hitting the UK’s 2050 decarbonisation targets without continued reliance on gas, the National Grid has warned.

In a new report, entitled The Future of Gas: How gas can support a low carbon future’, the grid says that it is not feasible to switch over to electric heating on the scale required to reduce greenhouse gas emissions to 80 per cent of 1990 levels by the middle of this century.

Two inches of snow will fall TONIGHT before the coldest night of the year hits TOMORROW with temperatures of -10C and wintry showers

by A Matthews and M Duell, November 29, 2017 in MailOnline


  • Widespread frost and snowfall is on the way with temperatures plummeting in London by this evening

  • Parts of Scotland could fall to -10C (14F), lower than the -8C forecast in Lapland and OC in St Petersburg

  • Met Office has issued ice warnings for northern Scotland and England  with 2in inches of snow set to fall

  • Snow is also forecast for North East England tomorrow including up to 4in on the North York Moors


Drilling set to begin in British shale

by Daniel J. Graeber, July 28, 2017


“With the decline of North Sea gas and our ever increasing reliance on gas imports, including shale gas imported from the United States, developing an indigenous source of natural gas is critical for U.K. energy security, our economy, jobs and the environment,” Cuadrilla CEO Francis Egan said in a statement. “We are proud as a Lancashire company to be at the forefront of that effort.