Siberia on fire – every summer

by Pasi Autio, July 14, 2020 in WUWT


Northern hemisphere summer – the season when forest fires in Siberia are on the loop. And usually every single new article about the Siberian forest fires somehow links them to climate change. Therefore it is good time to see how the forest fires has changed during the years. Is there really an increasing trend of Siberia forest fires as the news suggests and what is continuously predicted based on climate models?

With an area of 13.1 million square kilometres (5,100,000 sq mi), Siberia accounts for 77% of Russia’s land area. Majority of the Siberia is sparsely inhabited wilderness with little or no roads. Therefore, what sets on fire, usually burns until rain or other natural factor ends the fire. Southern Siberia also has extensive logging.

Getting reliable fire area data based on available literature seems to be problematic. According to the literature (1) USSR-era fire area data is unreliable and was consistently and severely underreporting fires on sparsely populated areas due to incomplete reporting structure that left most of the country unmonitored (6). The situation was improved only after western satellite data was taken in use by post-USSR Russia. But considering the size of Siberia and the fact that it is very sparsely populated, it is not wonder that no reliable data can be generated without the help of satellites. But even on satellite era some smaller fires goes undetected due to cloud cover or sensor detection limits (6).

After extensive literature study, I found no actual study providing satellite-based dataset for Siberian forest fires for post-USSR era either, which is strange considering how much coverage the Siberian forest fires have got lately. There seem to be an effort going on to create such a dataset for USSR-era years, however, by digitizing old satellite images taken since 1979, but let’s discuss that later a bit more.

Annual burned area in Siberia 1997-2016

Wildfire, Siberia: 123rf.com

Figure: Natural forest fire in Russia.

Acid Oceans? & Oyster Shells

by Jim Steele, July 14, 2020 in WUWT


(I wrote a white paper for the CO2  Coalition, providing more details and references to peer reviewed science regards how marine life counteracts ocean acidification. That paper can be downloaded here )

Search the internet for “acid oceans” and you’ll find millions of articles suggesting the oceans are becoming more corrosive due the burning of fossil fuels, and “acid oceans” are threatening marine life. Although climate modelers constantly claim the oceans’ surface pH has dropped since the 1800s, that change was never measured, as the concept of pH was not created until the early 1900s by beer-makers.

In 2003 Stanford’s Dr. Ken Caldeira coined the term “ocean acidification” to generate public concern about increasing CO2  . As New Yorker journalist Elizabeth Kolbert reported, “Caldeira told me that he had chosen the term ‘ocean acidification’ quite deliberately for its shock value. Seawater is naturally alkaline, with a pH ranging from 7.8 to 8.5—a pH of 7 is neutral—which means that, for now, at least, the oceans are still a long way from actually turning acidic.” Nonetheless Caldeira’s term “ocean acidification” evoked such undue fears and misunderstandings, we are constantly bombarded with catastrophic media hype and misdiagnosed causes of natural change.

For example, for nearly a decade the media has hyped the 2006-2008 die-off of larval oysters in hatcheries along Washington and Oregon. They called it a crisis caused by rising atmospheric CO2  and the only solution was to stop burning fossil fuels. But it was an understanding of natural pH changes that provided the correct solutions. Subsurface waters at a few hundred meters depth naturally contain greater concentrations CO2  and nutrients and a lower pH than surface waters. Changes in the winds and currents periodically bring those waters to the surface in a process called upwelling. Upwelling promotes a burst of life but also lowers the surface water pH.  Not fully aware of all the CO2  dynamics, the hatcheries had made 3 mistakes.

‘Most Of The Globe’ Could Experience ‘No Warming’ For 30 Years Due To Temperature-Driving Internal Variability

by Maher et al., July 13, 2020 in K.Richard/NoTricksZone


A new study documents the dominance of internal variability in decadal-scale global temperature changes and suggests we may experience a global cooling trend during the next 15 or even 30 years despite rising greenhouse gases.

Maher et al. (2020) acknowledge that internal variability in global surface temperature variations is “a difficult concept to communicate” because we have very few observations of its impact and so we must rely on assumptions about how the climate system might work.

Those who try to explain how internal variability affects global surface temperature often use the “Butterfly Effect” paradigm; they assume that small changes now can lead to larger changes decades from now.

Because global temperature trends are “largely determined by internal variability”, global cooling or another warming hiatus could very well be observed over the next decade. Actually, as Maher and colleagues explain, “even out to thirty years large parts of the globe (or most of the globe in MPI-GE and CMIP5) could still experience no-warming due to internal variability“.

BBC Asks Dr. Willie Soon to Respond to Climate Conspiracy Claims

by Eric Worall, July 13, 2020 in WUWT


The BBC has belatedly decided they need at least a little input from one of the targets of their latest big oil climate conspiracy propaganda piece. Dr. Willie Soon does not hold back in his response.

Note some of the links take you to a “You are leaving the mail.com service” page. This is a harmless artefact caused by copying Dr. Soon’s email, click continue to see the referenced document.


Dear Ms. Keane,

I am wary of responding to your false allegations, since your questions seem somewhat loaded. Disappointingly, they appear to repeat the dishonest and misleading claims of the former Greenpeace USA research director, Kert Davies (now running the so-called “Climate Investigations Center”), whose research we have shown to be disingenuous in Section 2 of our attached 2018 report on Greenpeace (Attachment 1). Unfortunately, the premise of your series seems to be the dangerous conspiracy theories promoted by Naomi Oreskes and Erik Conway in their 2010 book Merchants of Doubt: How a Handful of Scientists Obscured the Truth on Issues from Tobacco Smoke to Climate Change and their 2014 film of the same name. I’ve attached a short 3-page .pdf (Attachment 2) summarizing just a few examples of the poor scholarship and bizarre hypocrisies in Oreskes & Conway’s conspiracy theories.

The BBC has an established history of stifling genuine scientific inquiry and nuanced debate on climate change since its infamous 2006 Climate Change – the Challenge to Broadcasting? seminar, as described in detail in Andrew Montford’s short book The Propaganda Bureau and summarized in various blogs in 2012, e.g., hereherehere and here.

It is also regrettable that you attempted to contact me in such a roundabout way, i.e., by going through the Heartland Institute, rather than emailing me directly here at the Harvard-Smithsonian Center for Astrophysics. I am not pleased that you saw fit to circulate your letter, with its numerous libellous comments, to a third party.

The BBC seems to encourage the unethical pseudo-journalistic practice of selectively quoting and cherry-picking out-of-context interviewees who disagree with the narrative of the program, in order to make the interviewees seem foolish or uninformed. Richard North, summarized this unethical practice well in this 2011 essay: https://eureferendum.blogspot.com/2011/01/on-being-stitched-up.htmlThis was a particular concern when I considered whether to reply to your allegations.

I am hoping that you have more journalistic integrity than your BBC colleagues who have carried out unethical “hatchet jobs” in the past. I suspect that you may not be planning to “fairly and accurately reflect any comments” as you promised me.

Nonetheless, given the number of false allegations you are threatening to broadcast, I feel compelled to respond. I have copied this letter a number of friends and colleagues who might be interested to see the questions you have asked me and my responses.

I have copied and pasted your letter to me below. Your letter is in bold face: and my responses are in Roman face.

Will you change course in your grave misunderstanding on this timely subject and uphold honest debate and discussion on climate science?

Yours faithfully,

Willie Soon

Carbon dioxide level unprecedented in 15 MY… More evidence it’s not the climate control knob!avid Middl

by David Middleton, July 10, 2020 in WUWT


If the Earth was 3-4 °C warmer with a much higher sea level 3.3 million years ago, with about the same CO2 concentration, what does this say about the potency of it as a climate control knob?

The last time CO2 levels were this low, Earth was in the deepest ice age of the Phanerozoic Eon, the Pennsylvanian (Late Carboniferous)-Early Permian.

Figure 5. Phanerozoic temperatures (pH-corrected) and carbon dioxide. The Miocene is the first epoch of the Neogene Period (Berner et al, 2001 and Royer et al., 2004) (older is toward the left).

HIGHEST U.S. TEMPERATURES ON RECORD BY STATE

by Cap Allon, July 12, 2020 in Electroverse


Historical documentation destroys the man-made global warming theory.

While those in control of the temperature graphs are all too happy to fraudulently increase the running average, what they haven’t (yet) had the balls to do is rewrite the history books.

As Tony Heller uncovers on his site realclimatescience, NASA routinely cools the past and heats the present, so to give the illusion of a greater warming trend — and comparisons between old and new graphs instantly reveals this fraud:

In 1999, NASA’s James Hansen reported 0.5C US cooling since the 1930’s:

By 2016, the same NASA graph has eliminated that 1930-1999 cooling:

Decadal Climate Prediction? Might As Well Throw A Dice!

by P. Homewood, July 12, 2020 in NotaLotofPeopleKnowThat


https://hadleyserver.metoffice.gov.uk/wmolc/

The WMO has collated global temperature projections from twelve different organisations, covering this year and the next five years. They were produced in 2019.

It is totally clear that there is very little agreement between any of them, other than a warm Arctic.

An unkind person might call them a waste of space!

Arctic Ocean changes driven by sub-Arctic seas

by University of Alaska Fairbank, July 12, 2020 in WUWT


New research explores how lower-latitude oceans drive complex changes in the Arctic Ocean, pushing the region into a new reality distinct from the 20th-century norm.

The University of Alaska Fairbanks and Finnish Meteorological Institute led the international effort, which included researchers from six countries. The first of several related papers was published this month in Frontiers in Marine Science.

Climate change is most pronounced in the Arctic. The Arctic Ocean, which covers less than 3% of the Earth’s surface, appears to be quite sensitive to abnormal conditions in lower-latitude oceans.

“With this in mind, the goal of our research was to illustrate the part of Arctic climate change driven by anomalous [different from the norm] influxes of oceanic water from the Atlantic Ocean and the Pacific Ocean, a process which we refer to as borealization,” said lead author Igor Polyakov, an oceanographer at UAF’s International Arctic Research Center and FMI.

Although the Arctic is often viewed as a single system that is impacted by climate change uniformly, the research stressed that the Arctic’s Amerasian Basin (influenced by Pacific waters) and its Eurasian Basin (influenced by Atlantic waters) tend to differ in their responses to climate change.

Since the first temperature and salinity measurements taken in the late 1800s, scientists have known that cold and relatively fresh water, which is lighter than salty water, floats at the surface of the Arctic Ocean. This fresh layer blocks the warmth of the deeper water from melting sea ice.

IMAGE: A MAP OF THE ARCTIC OCEAN SHOWS THE LOCATION OF THE AMERASIAN AND EURASIAN BASINS. ARROWS SHOW THE PATH OF WARM, FRESH PACIFIC WATER AND WARM, SALTY ATLANTIC WATER INTO… view more CREDIT: GRAPHIC ADAPTED FROM POLYAKOV ET AL. 2020, FRONTIERS IN MARINE SCIENCE PAPER.

Facebook Accused of Allowing Climate Deniers to Promote Their Views

by Eric Worrall, July 8, 2020 in WUWT


A group calling themselves climate power have demanded Facebook take a more aggressive stance against people who promote what they claim are climate lies. The signatories to their open letter include failed radical green Democrat candidate Tom Steyer, and former Clinton administration chief of staff John Podesta.

10 fallacies about Arctic sea ice & polar bear survival refute misleading ‘facts’

by S. Crockford, July 8, 2020 in WUWT


This updated blog post of mine from last year is as pertinent now as it was then: it’s a fully-referenced rebuttal to the misleading ‘facts’ so often presented this time of year to support the notion that polar bears are being harmed due to lack of summer sea ice. Polar Bears International developed ‘Arctic Sea Ice Day’ (15 July) to promote their skewed interpretation of polar bear science at the height of the Arctic melt season. This year I’ve add a ‘Polar Bears and the Arctic Food Chain‘ graphic, which readers are free to download and share. For further information, see “The Polar Bear Catastrophe That Never Happened“.

Remember when we were told: “The Arctic Is On Fire, and We Should all Be Terrified”? It’s SNOWING there now.

by Anthony Watts, July 7, 2020 in WUWT


From the “weather is not climate”, you идиот department comes this about face by climate change nature.

Remember just a couple of weeks ago we were lectured to about the dangers of climate change turning towns around the Arctic circle into easy-bake ovens?

Well, I pointed out how absurd this all was, especially since it also happened 100 years ago, before the climate change was even a glimmer in leftists eyes. And, because with 24 hour sunlight at the peak of the summer solstice, the area is bound to get hot, because there’s no “night” to cool off. Of course, that didn’t stop opportunistic trough-feeding scientists like Mark “the Arctic is screaming” Serreze from taking advantage of the situation, claiming it was all part of a disturbing pattern.

Naturally, the visual that was produced on Twitter to scare people was pretty convincing to the non-thinking media types that pounced on the story.

Facebook Censor Mike Schellenberger For Telling The Truth

by P. Homewood, July 8, 2020 in NotaLotofPeopleKnowThat


https://twitter.com/ShellenbergerMD/status/1280598424174292992

Not for the first time, Facebook have acted on the request of a fake Factcheck from climate activists.

Readers may recall a similar occurrence a few months ago, when Facebook objected to an article about the Australian bushfires. which originated from the NSW firefighters association. As with this one, Facebook were acting upon a “Factcheck” from an outfit called Climate Feedback.

As I showed at the time, the “Factcheck” was totally erroneous. At the time, I wrote to Climate Feedback and asked them to retract, as this was the only way Facebook were prepared to reverse their objection. I received no reply.

No surprise then that the censorship of Schellenberger this time is the result of a “Factcheck” from the same Climate Feedback group.

Mike Schellenberger gives a lot more detail in his twitter feed, linked above.

Flawed Models: New Studies Find Plants Take Up “More Than Twice As Much” CO2 Than Expected

by Fritz Vahrenholt, July 7, 2020 in NoTricksZone


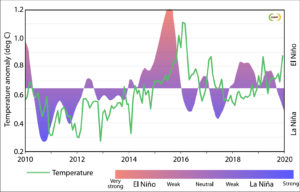
First, the global mean temperature of satellite based measurements was surprisingly much higher in May 2020 than in April. In contrast, the global temperatures of the series of measurements on land and sea decreased. The difference can be explained by the fact that under warm El-Nino conditions the satellite measurements lag about 2-3 months behind the earth-based measurements.

From November 2019 to March 2020 a moderate El-Nino was observed, which has now been replaced by neutral conditions in the Pacific. Therefore, it is to be expected that also the satellite based measurements, which we use at this point, will show a decrease in temperatures within 2-3 months.

The average temperature increase since 1981 remained unchanged at 0.14 degrees Celsius per decade. The sunspot number of 0.2 corresponded to the expectations of the solar minimum.

The earth is greening

Don’t Panic: Leading Scientists See Little Global Warming, Just ‘Natural Variability’

by F. Vahrenholt, July 6, 2020 in ClimateChangeDispatch


A commentary titled “‘Just don’t panic – also about climate change’” by Prof. Fritz Vahrenholt appearing at German site achgut.comtells us there’s no need for panic with respect to climate change, as leading scientists dial back earlier doomsday projections.

No warming until 2050

Vahrenholt claims a negative Atlantic oscillation is ahead of us and the expected second weak solar cycle in succession will reduce anthropogenic warming in the next 15-30 years.

He cites a recent publication by Judith Curry, who sees a pause in the temperature rise until 2050 as the most likely scenario.

Vahrenholt and Curry are not alone when it comes to believing natural-variability-watered-down warming is in the works.

Also, IPCC heavyweight Jochem Marotzke from the Max Planck Institute for Meteorology in Hamburg takes a similar stand in a publication in the Environmental Research Letters.

In the paper, Marotzke concludes that all locations examined show “a cooling trend or lack of warming trend” and that there is “no warming due to natural cooling effects” and that in calculations up to 2049.

The researchers find “a large part of the earth will not warm up because of internal variability.”

Distancing from alarmists Schellnhuber, Rahmstorf

And recently The Max Planck Institute Director Marotzke said in an interview with Andreas Frey of the Frankfurter Allgemeinen Zeitung (FAZ) that there was no need to panic, thus clearly splitting from the doomsday scenarios put out by his alarmist colleagues Hans-Joachim Schellnhuber and Stefan Rahmstorf.

In the FAZ interview, Marotzke also said there was no need to worry that the port city of Hamburg would be flooded in 2100: “Hamburg will not be threatened, that is totally clear.”

Areas not going to be wiped out

Marotzke then told the FAZ that the fears that children have today for the future are not absolutely well-founded, and that entire areas are not going to be wiped out, as often suggested by alarmists.

Sensational French models

DESPITE THE LIES, THE SPIN, AND THE PROPAGANDA, ANTARCTIC SEA ICE IS GROWING — BOTH EXTENT AND CONCENTRATION GREATER NOW THAN IN 1980

by Cap Allon, July 6, 2020 in Electroverse


The UN and their scraggly little offshoot, the IPCC, are at it again — obfuscating data in order to push their fraudulent catastrophic global warming agenda.

According to the IPCC, and picked up the usual AGW propaganda rags such as the Guardian: “the South pole is warming three times faster than rest of the world.”

The Guardian articledated June 30, 2020 continues in predictably befogging fashion: “Dramatic change in Antarctica’s interior in past three decades a result of effects from tropical variability working together with increasing greenhouse gases.”

But, 1) the MSM have a habit of claiming everywhere is warming faster than everywhere else:

And 2), the actual data reveals quite the opposite re Antarctica.

As @Harry_Hardrada recently pointed out on Twitter, there was a larger extent and concentration of Antarctic Sea Ice in June 2020 than back in June 1980:

Robert Felix over at iceagenow.com dives into the data, adding that sea ice extent today stands at 700,000 sq km (270,272 sq miles) greater than in 1980.

And in case you’re having a hard time reading the numbers, Felix breaks them down for you:

Sea ice extent in June 2020 = 13.2 million sq km
Sea ice extent in June 1980 = 12.5 million sq km

Sea ice concentration in June 2020 = 10.6 million sq km
Sea ice concentration in June 1980 = 9.6 million sq km

Fact-checked!

That’s enough extra ice to entirely cover Maryland, Delaware, West Virginia, South Carolina, Virginia, Indiana, Ohio and all six New England states. Oh, and throw in Washington, D.C. for good measure. (Which might be a good idea.)

 See also THE ARCTIC IS ON FIRE, AND WE SHOULD ALL BE TERRIFIED” — FACT CHECK: IT’S CURRENTLY SNOWING IN VERKHOYANSK

Hot Summer Epic Fail: New Climate Models Exaggerate Midwest Warming by 6X

by Dr Roy Spencer, July 3, 2020 in GlobalWarming


For the last 10 years I have consulted for grain growing interests, providing information about past and potential future trends in growing season weather that might impact crop yields. Their primary interest is the U.S. corn belt, particularly the 12 Midwest states (Iowa, Illinois, Indiana, Ohio, Kansas, Nebraska, Missouri, Oklahoma, the Dakotas, Minnesota, and Michigan) which produce most of the U.S. corn and soybean crop.

Contrary to popular perception, the U.S. Midwest has seen little long-term summer warming. For precipitation, the slight drying predicted by climate models in response to human greenhouse gas emissions has not occurred; if anything, precipitation has increased. Corn yield trends continue on a technologically-driven upward trajectory, totally obscuring any potential negative impact of “climate change”.

What Period of Time Should We Examine to Test Global Warming Claims?

Based upon the observations, “global warming” did not really begin until the late 1970s. Prior to that time, anthropogenic greenhouse gas emissions had not yet increased by much at all, and natural climate variability dominated the observational record (and some say it still does).

Furthermore, uncertainties regarding the cooling effects of sulfate aerosol pollution make any model predictions before the 1970s-80s suspect since modelers simply adjusted the aerosol cooling effect in their models to match the temperature observations, which showed little if any warming before that time which could be reasonably attributed to greenhouse gas emissions.

This is why I am emphasizing the last 50 years (1970-2019)…this is the period during which we should have seen the strongest warming, and as greenhouse gas emissions continue to increase, it is the period of most interest to help determine just how much faith we should put into model predictions for changes in national energy policies. In other words, quantitative testing of greenhouse warming theory should be during a period when the signal of that warming is expected to be the greatest.

50 Years of Predictions vs. Observations

Now that the new CMIP6 climate model experiment data are becoming available, we can begin to get some idea of how those models are shaping up against observations and the previous (CMIP5) model predictions. The following analysis includes the available model out put at the KNMI Climate Explorer website. The temperature observations come from the statewide data at NOAA’s Climate at a Glance website.

For the Midwest U.S. in the summer (June-July-August) we see that there has been almost no statistically significant warming in the last 50 years, whereas the CMIP6 models appear to be producing even more warming than the CMIP5 models did.

How Climate Trickery Infiltrated the AGU

by Donna Laframboise, July 2020, In BigPicturesNews


11 presentations – based on private, agenda-driven research – were delivered to the world’s largest gathering of climate scientists.

I’ve been writing about a far-fetched climate fairy tale that was repackaged and re-positioned – with the result that it now gets taken seriously by supposedly serious scientists (see here and here).

How did this happen? First, billionaire climate activists hired consultants to produce a brand new climate analysis. Because, you know, the world doesn’t have enough climate research, what with governments spending billions on it every year.

This custom research was conducted by a team of noticeably young people. One is still working on his doctorate. Two others were doctoral students at the time. The lead scientist had earned his geobiology PhD seven years earlier. The lead economist had earned his, in sustainable development, a mere three years earlier.

This team produced a 2014 report titled Risky Business: The Economic Risks of Climate Change in the United States. It features a graphic that wildly misrepresents the scientific literature.

Six months after that report appeared, fully 11 presentations based on it were delivered at the world’s largest annual gathering of earth scientists – the American Geophysical Union’s December 2014 conference.

Extensive hake (fish) skeletal remains in ocean waters too cold for this species to occupy today suggest past ocean temperatures were several degrees warmer.

by Wheeland & Morgan, July 2020 in NoTricksZone


Fish habitats are limited by specific temperature boundaries. In a new study, for example,  Wheeland  and Morgan (2020) found there was a pronounced ocean warming from the 1980s to late 1990s off the coasts of Greenland. This temperature shift changed the distribution of halibut habitat. Since then, however, there has been no net warming in the study region (through 2016).

A “Good” Proxy on the Antarctic Peninsula?

by Steve McIntyre, June 30, 2014 in ClimateAudit


Nearly all of the text of this article on an interesting ice core proxy series (James Ross Island) from the Antarctic Peninsula was written in June 2014, but not finished at the time for reasons that I don’t recall.  This proxy was one of 16 proxy series in the Kaufman 12K pdf. 60-90S reconstruction.

I originally drafted the article because it seemed to me that the then new James Ross Island isotope series exemplified many features of a “good” proxy according to ex ante criteria that I had loosely formulated from time to time in critiquing “bad” proxies, but never really codified (in large part, because it’s not easy to codify criteria except through handling data.)

Although this series is in the Kaufman 60-90S reconstruction, its appearance is quite different than the final 60-90S reconstruction: indeed, it has a very negative correlation (-0.61) to Kaufman’s final CPS reconstruction. I’ll discuss that in a different article.

Following is mostly 2014 notes, with some minot updating for context.

“Good” Proxies
I’ve articulated with increasing clarity over the years (but present in early work as well) – is that one needs to work outward from proxies that are “good” according to some ex ante criteria, rather than place hope in a complicated multivariate algorithm on inconsistent and noisy data, not all of which are “proxies” for the item being reconstructed. This is based on principles that I’ve observed in use by geophysicists and geologists to combine “good” (high resolution) data with lower quality data.

WHY CARBON DIOXIDE CAN’T CAUSE WARMING IN THE ATMOSPHERE, BY PROFESSOR EMERITUS OF GEOLOGY AT WESTERN WASHINGTON UNIVERSITY

by Cap Allon, July 5, 2020 in Electroverse


ABSTRACT

A greenhouse gas is a gas that absorbs and emits infrared radiation.

The primary greenhouse gases in the atmosphere are water vapor, carbon dioxide, methane, nitrous oxide, and ozone. Atmospheric carbon dioxide (CO2) is a nontoxic, colorless, odorless gas.

Water vapor accounts for by far the largest greenhouse effect (90–85%) because water vapor emits and absorbs infrared radiation at many more wavelengths than any of the other greenhouse gases, and there is much more water vapor in the atmosphere than any of the other greenhouse gases. CO2 makes up only a tiny portion of the atmosphere (0.040%) and constitutes only 3.6% of the greenhouse effect. The atmospheric content of CO2 has increased only 0.008% since emissions began to soar after 1945. Such a tiny increment of increase in CO2 cannot cause the 10°F increase in temperature predicted by CO2 advocates.

Computer climate modelers build into their models a high water vapor component, which they claim is due to increased atmospheric water vapor caused by very small warming from CO2, and since water vapor makes up 90–95% of the greenhouse effect, they claim the result will be warming.

The problem is that atmospheric water vapor has actually declined since 1948, not increased as demanded by climate models. If CO2 causes global warming, then CO2 should always precede warming when the Earth’s climate warms up after an ice age. However, in all cases, CO2 lags warming by ∼800 years. Shorter time spans show the same thing–warming always precedes an increase in CO2 and therefore it cannot be the cause of the warming.

A Hydrogen Future? Some Basic Facts

by P. Homewood, July 5, 2020 in NotaLotofPeopleKnowThat


There has been a wide ranging debate about hydrogen in the last couple of days, so I thought it worthwhile to recap some of the basic facts. Most of these are from the Committee on Climate Change’s Net Zero report last year, otherwise I will provide links.

I have referred to many of these facts before, but they sometimes get lost in the fog of technical debate. If anybody disagrees with these facts, please explain where the CCC went wrong.

Production

There are essentially two methods of producing hydrogen:

1) Steam reforming

This process typically usually uses natural gas as the feedstock, but produces CO2 as a by-product. Therefore, for the process to be “low carbon”, carbon capture and storage would be necessary. Unfortunately even then not all of the CO2 is captured. Allowing for upstream emissions as well, the CCC estimate that the process will only reduce emissions by 60 to 85%, compared to burning natural gas instead.

The cost of producing hydrogen via steam reforming with CCS is estimated to be triple the current wholesale price of natural gas (ie before adding distribution costs).

2) Electrolysis

The CCC explain why electrolysis can only offer a limited contribution:

Flaming June? Hardly

by P. Homewood, July 1, 2020 in NotaLotofPeopleKnowThat


Phew, what a scorcher?? Hardly.

Despite the hype of the last week, the average temperature in England last month was pretty ordinary.

https://www.metoffice.gov.uk/hadobs/hadcet/data/download.html

According to the Central England Temperature series, June 2020 was only the 59th warmest on record.

Not only were the four hottest Junes prior to 1900, no June since 1976 has been in the top 17.

image

https://www.metoffice.gov.uk/hadobs/hadcet/mly_cet_mean_sort.txt

CO2 Coalition Corrects the Record on How to Report on Climate Science

by C. Rossiter, December 17, 2019 in CO2Coalition


Memo to the Media: Don’t Use Bad Words!

13 misleading phrases about industrial warming gases and policies to slow their increase.

 By: Dr. Caleb Rossiter, Executive Director of the CO2 Coalition

1. Climate change (as in “climate change is real”): Climate change is indeed real, and humans have little to do with it.

What is the specific change you have in mind?  Is it a typical fluctuation or a statistically significant trend?  Is it caused by an increase in average temperature, locally or globally?  Is the increase driven by CO2 levels, or natural causes?  The scientific answer to each of these questions is usually complex, uncertain, and not alarming at all.

2. Climate “crisis” (or “emergency”): There is no climate crisis or emergency.

UN IPCC data show no statistically significant trends in “crisis” variables like storms, floods, hurricanes, droughts and rate of sea-level rise in the last 100 years.  That is before CO2 emissions could have had a measurable impact on temperature.

3. “A consensus (of 97% of scientists) agrees”: Agrees about precisely what?

This has nothing to do with claims of a “crisis,” or with the potential of “renewable” energy.  The “consensus” was declared by non-scientists, who judged the content of articles in science journals – often incorrectly.  They tried to determine whether the articles agreed with the IPCC opinion that at least 0.25 of the 1°C rise in global average temperature since 1900 was likely caused by industrial CO2 emissions.

4. “It’s already happening”: This confuses climate with weather.

Climate – a statistical average – is what we expect; weather – random and often extreme fluctuations – is what we get. Hurricanes Harvey, Andrew, Sandy, and Katrina, California wildfires, regional droughts and floods, and sea-level rise are all almost entirely natural.  Similar events occur in historical records going back millennia.

5. “(X out of the Y) warmest months, years, decades on record have occurred recently”: This has been true throughout the past 250 years, for natural reasons.

Temperature has been rising slowly and steadily since the Little Ice Age, well before CO2 levels increased.  Slightly higher records are to be expected.

6. CO2 emissions are causing “ocean acidification”: The ocean will never become acidic (i.e. below “neutral” 7 on the pH scale).

Sea water is alkaline, not acidic, with a pH of around 8.  A one-unit change to 7 on this logarithmic scale would require a 10-fold increase in pH.  Even a tripling of current CO2 levels, over 600 years, would drive pH down only to 7.8.  Rainwater is naturally acidic, at 5.6.  Ocean health is improved by the plant and phytoplankton food: CO2.

7. “Carbon pollution”: CO2 is not a “pollutant” but an essential plant food.

A pollutant damages human health.  CO2 is an inert, natural, non-toxic, mild warming gas.  The rise of CO2 levels from 0.03% of the atmosphere to 0.04% has increased plant growth by a third.  Human breath has 100 times this level.  EPA does not list CO2 as a “criteria pollutant,” like carbon monoxide (CO) from cars and sulfur dioxide from power plants.  Ironically, catalytic converters remove these real pollutants by oxidizing them to CO2.

8. Social Cost of Carbon (SCC): There is a far greater cost to using “renewables.”

The current SCC of $40 in damages per metric ton of CO2 is based on 300-year projections of the economy and CO2-driven extreme weather.  Both are wildly uncertain.  At present the true cost of wind and solar is four times that of fossil fuels, per mile of travel and per kilowatt-hour of electricity.  The SCC ignores these costs.

9. Renewable Energy: Converting it to power is NOT renewable.

Wind and solar are free and renewable but using them is not.  The costly turbines, solar panels, batteries, and transmission lines must be mined, produced, transported, and disposed of after their short lifetimes.  What powers those industries?  Reliable, cheap fossil fuels.

10. “Highest CO2 levels in (thousands, millions) of years”: Correlation is not causation.

Al Gore tried to convince movie-goers that CO2 and temperature “go together.”  Indeed, they do, but on these time scales, it is temperature that drives CO2.  As the Earth has warmed and cooled over the past million years of recurrent ice ages, changes in CO2come long after changes in temperature.  That’s because CO2 is released from warming oceans and land and is absorbed again when they cool.

11. “Climate models predict…”: No, IPCC computer estimations “project scenarios”

The IPCC’s models run about three times too “hot.”  Why?  Because they “tune” the models to make past CO2 levels drive temperature changes.  Nature hasn’t cooperated with their theory of strong warming when the models are run into the future.  The models require thousands of guesses about physics and economics, and their error bands are bigger than their projected temperature results.

12. “Exxon Knew”: That alarmist science was uncertain.

The #ExxonKnew lawsuits are based on a fraud: the plaintiffs and their advocates cynically edit Exxon’s scientific memos before quoting them, removing key words and phrases.  This reverses the scientists’ conclusions, because they were summarizing alarmist predictions and explaining their uncertainties.

13. “The debate is over”: See 1-12, above.

A PDF of this memo can be downloaded at Memo to the Media.

When Exposed To Natural, Long-Term Extreme ‘Ocean Acidification’, Coral And Urchin ‘Persist’ And Even ‘Thrive’

by K. Richard, June 29, 2020 in NoTricksZone


Marine species subjected to high CO2 extremes – 8,891 to 95,000 ppm – in their natural environments may not be adversely affected. They may even “thrive”.

Earlier this year we highlighted a study that says coral reefs “thrive” near seafloor volcanic vents where CO2 concentrations reach 60,000 to 95,000 ppm.

Urchins basking in volcanic vent streams of 8,891 ppm CO2 and daily CO2 variations of more than 2,000 ppm as well as day-to-day pH fluctuations ranging from 6.9 (“acidification”) to 8.1…grow more than two times faster than nearby control (stable 394 ppm CO2, 8.1 pH) urchins (Uthicke et al., 2016).

Climate alarmism versus integrity at National Academies of Science

by D. Wojick, June28, 2020 in WUWT


National Academies of Science should speak out against climate alarmism, not support it. This is the major message in a recent letter from Professor Guus Berkhout, president of CLINTEL, to the new head of the Royal Netherlands Academy of Arts and Sciences. The integrity of science is at stake.

This letter is a model for how all alarmist National Academies should be addressed. For example, the US National Academy of Sciences (NAS) is painfully alarmist. Even worse, NAS has been joined in promoting alarmism by its two siblings, the National Academies of Engineering and Medicine. The fact that these Academies have become a servant of supranational political organizations such as IPCC shows how serious the crisis in climate science really is.

The Netherlands Academy is called KNAW, from its Dutch name. KNAW was established in 1808 as an advisory body to the government, a task it still performs today. NAS was established by Congress in 1868. Both NAS and KNAW derive their authority from their high profile members, rigorously selected top scientists from a large range of scientific fields. Professor Berkhout is a member of KNAW.

The letter is addressed to Prof. Dr. Ineke Sluiter, President of KNAW. It begins with a clear statement of the issue:

I am addressing you in your capacity as the new President of the KNAW because the climate issue is escalating. The IPCC and the associated activist climate movement have become highly politicised. Sceptical scientists are being silenced. As an IPCC expert reviewer, I critically looked at the latest draft climate report. My conclusion is that there is little evidence of any intent to discover the objective scientific truth.

La géologie, une science plus que passionnante … et diverse