by C3 Headlines, April 2018
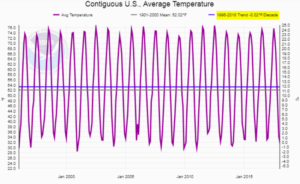
The chart above was produced by NOAA at their ‘Climate at a Glance’ web page. In the upper right corner of the chart, NOAA shows its calculated per decade trend of -0.02°F for a period that spans 1996-2018.
After posting this chart and an accompanying article, it just seemed that something was likely wrong with the trend calculation produced by NOAA’s web site.