by Craig Idso, February 26, 2020 in ClimateChageDispatch
Paper Reviewed:
Huang, J., Ou, T., Chen, D., Lun, Y. and Zhao, Z. 2019. The amplified Arctic warming in recent decades may have been overestimated by CMIP5 models. Geophysical Research Letters 46: 13,338-12,345.Policies aimed at protecting humanity and the environment from the potential effects of CO2-induced global warming rely almost entirely upon models predicting large future temperature increases.
But what if those predictions are wrong? What if a comparison between model projections and observations revealed the models are overestimating the amount of warming?
Would climate alarmists admit as much and back away from promoting extreme policies of CO2 emission reductions?
Probably not — at least based upon the recent rhetoric of each of the candidates seeking the Democrat Party’s nomination for President of the United States, all of whom continue to call for the complete elimination of all CO2 emissions from fossil fuel use within the next three decades, or less.
But for non-ideologues who are willing to examine and accept the facts as they are, the recent work of Huang et al. (2019) provides reason enough to pause the crazy CO2 emission-reduction train.
In their study, the five researchers set out to examine how well model projections of Arctic temperatures (poleward of 60°N) compared with good old-fashioned observations.
More specifically, they used a statistical procedure suitable for nonlinear analysis (ensemble empirical mode decomposition) to examine secular Arctic warming over the period 1880-2017.
Observational data utilized in the study were obtained from the HadCRUT4.6 temperature database, whereas model-based temperature projections were derived from simulations from 36 Coupled Model Intercomparison Project Phase 5 (CMIP5) global climate models (GCMs).
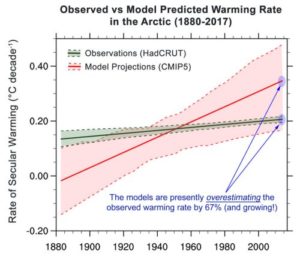
Figure 1. Observed and model-predicted rates of nonlinear, secular warming in the Arctic (60-90°N) over the period 1880-2017. The black and red dashed lines indicate the 10th and 90th percentiles for temperature means. Adapted from Huang et al. (2019).
As indicated there, the model-estimated rate of secular warming (the solid red line) increased quite sharply across the 138 year period, rising from a value of around 0°C per decade at the beginning of the record to a value of 0.35°C per decade in the end.
…