Thomas Crowther identifies long-disappeared forests available for restoration across the world. He will describe how there is room for an additional 1.2 trillion new trees around the world that could absorb more carbon than human emissions each year. Crowther also describes data from thousands of soil samples collected by local scientists that reveal the world’s Arctic and sub-Arctic regions store most of the world’s carbon. But the warming of these ecosystems is causing the release of this soil carbon, a process that could accelerate climate change by 17%. This research is revealing that the restoration of vegetation and soil carbon is by far our best weapon in the fight against climate change.
The living parts of the planet make it unique from all other parts of the solar system, and they drive every aspect of biogeochemical cycling. It is essential that we represent these living processes into our understanding of current and future biogeochemical cycles in order to understand and predict climate change.
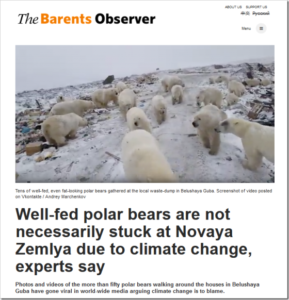
This story could very well be headlined: «When internet came to Novaya Zemlya».
Locals started to post photos and video of the more than 50 polar bears in their neighborhood. Over the last week, social media as well as online newspapers globally have gone mad over the news coming out from one of the remotest towns on the planet, the closed military settlement of Belushaya Guba.
The little-known town on the Russian Arctic archipelago have since last autumn been struggling with polar bears walking the streets and around the corners of apartment- and office buildings. Even walking by a baby-stroller inside an entrance, one of the video-recordings show.
Regional authorities have declared a state of emergency after the bears no longer react to noice- and light signals from guards trying to scare them off.
Belushaya Guba, like the entire Novaya Zemlya, is closed off military area. The newly upgraded air base Rogachevo is just a few kilometers outside of town.
Today any warming found anywhere almost always gets blamed on heat supposedly getting trapped by rising atmospheric CO2 concentrations. Moreover, activist scientists insist we ignore all other powerful factors such as solar and oceanic cycles.
In fact these activists have become so extreme that they insist that record cold today is caused by warming.
But as people learned already in the first grade, the earth’s surface warms when the sun shines on it, and tends to cool when clouds obstruct the sun.
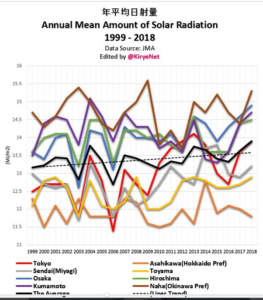
Solar radiation at the surface has risen over the past decades
In Japan, the Japanese Meteorology Agency (JMA) has 8 stations that measure solar radiation reaching the surface, and many other for recording temperature.
Data from the 8 stations recording solar radiation are plotted since 1999 (i.e. 20 years) as follows:
A significant number of scientists say that the Earth’s climate is in large part impacted by solar activity, and less so by trace gas CO2 concentration. German scientists present new findings showing a link between solar activity and precipitation in Europe.
=================================================
How Changes on the Sun Influences Rain
A balanced level of precipitation provides the basis for a wide range of economic and social activities in Europe. Particularly agriculture, drinking water supply and inland waterway transport are directly affected. However, the amount of rain fluctuates strongly from year to year. While it may pour torrentially in one year, rain may remain absent for weeks in other year. The population is used to this variability and usually knows how to deal with it.
But what is behind the strong changes? A system, or pure atmospheric noise?
A provocative hypothetical question: What if the Moon was not there? Video follows.
This giant rock lights up the night and can even change colors. So what would we do without it? Would we all need night vision goggles? How would it affect the ocean tides? Our seasons? Or our sleep cycles? Or would the consequences be far more drastic?
As the closest celestial body to our planet, the moon exerts a gravitational pull that governs much of what happens here on Earth Take the sea, for example. If you like surfing, you can thank the moon when the moon’s gravitational pull tugs on our spinning Earth, the oceans respond, giving us high tides in some parts of the world, and low tides elsewhere.
The Research Center for Gas Innovation is developing technology to separate CO2 and methane in oil and gas exploration and store it in offshore salt caverns
Fundação de Amparo à Pesquisa do Estado de São Paulo
A set of technologies that is expected to have its first results four years from now is designed to resolve one of the world’s greatest oil and gas exploration challenges today: carbon dioxide (CO2) and methane (CH4) emission in the atmosphere.
The innovation, the result of a patent deposited in 2018, consists of injecting the CO2 and CH4 that comes from wells during oil extraction into salt caverns as a way to reduce the amount of carbon gas in the emissions.
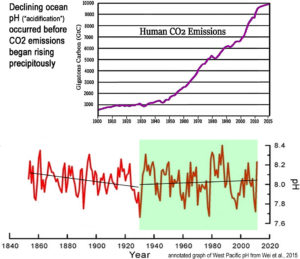
A modest long-term (1800s-present) declining trend in ocean pH values predominantly occurred prior to 1930, or before anthropogenic CO2 emissions began rising precipitously. Since 1930, seawater pH trends have risen slightly, meaning sharply rising CO2 has been coincident with less, not more, ocean “acidification”
by G. Geuskens, 14 février 2019, in ScienceClimatEnergie
Le climat peut changer, comme il l’a toujours fait et continuera à le faire sous l’action de variables naturelles. Les activités humaines peuvent-elles avoir une influence comme le prétend la théorie du réchauffement climatique d’origine anthropique ? Cette théorie est basée sur l’existence d’un hypothétique effet de serre défini comme un phénomène radiatifcausé par des gaz tels la vapeur d’eau ou le CO2 qui absorbent une fraction du rayonnement infrarouge émis par la Terre et le réémettent ensuite dans toutes les directions et notamment vers la surface terrestre dont la température serait, de ce fait, plus élevée qu’en l’absence de gaz absorbant l’infrarouge. L’effet de serre résulterait donc essentiellement de l’émission par les molécules de CO2 d’un rayonnement de fluorescence dans le domaine infrarouge [1]. Cette définition est claire et scientifiquement valable car conforme au principe de réfutabilité défini par Karl Popper. Nous l’examinerons à la lumière de théories physiques bien établies et de faits expérimentaux connus.
by J.C. Maurin, 8 février 2019, in ScienceClimatEnergie
A partir des notions intuitives de chaleur et température, les physiciens (Carnot, Thomson, Clausius, Maxwell, Boltzmann) arrivèrent progressivement à la notion scientifique de température thermodynamique. La Conférence Générale des Poids et Mesures adopta en 1927 l’échelle thermodynamique proposée en 1911, puis l’unité kelvin en 1954.
La notion de température thermodynamique nécessite que l’équilibre thermique soit atteint, ce qui n’est pas le cas dans l’atmosphère de la Terre. Il n’existe pas une « température thermodynamique de l’atmosphère ». A défaut, on utilise une « moyenne des températures » mesurées en divers points de l’atmosphère. Mais la température thermodynamique étant une grandeur intensive, une moyenne, quelle que soit son élaboration, ne peut jouer qu’un rôle d’indicateur. L’usage est néanmoins d’utiliser le kelvin pour les indicateurs. On exprimera de préférence les variations des indicateurs sous forme relative. L’indicateur va être dépendant de l’échantillonnage (spatial et temporel) des mesures et surtout de son mode d’élaboration.
Science differs from religion because theoretical claims have to be verified with observations. If model results can predict measurements in advance (which is quite different than explaining them afterwards!) then you can say the model validated and then apply it in practice. But if that is not the case, then you cannot sell the model as truth and using it in practice is irresponsible.
Far more complicated than simple, linear CO2 relationship
The current climate model (‘IPCC model’) systematically yields highly overstated predictions compared to measurements and can therefore not be used to form climate policy – especially if that policy results in extremely high costs and destabilises vital parts of the energy infrastructure.
We are not just saying that. Already some of the most renowned scientists have preceded us (e.g. Freeman Dyson, Frederic Seitz, Robert Jastrow, William Nierenberg), including Nobel Prize winners (e.g. Ivar Giaever and Robert Laughlin). They also argue that the earth’s climate is far too complicated to be explained by a simple one-dimensional CO2 relationship.
by P. Homewood, February 11, 2019 in NotaLotofPeopleKnowThat
London, 11 February: The scientific paper behind newspaper claims that insect populations were threatened with extinction was based on data known to be unreliable. That’s according to the Global Warming Policy Foundation, which today called for the paper to be withdrawn.
The paper, by US scientists Bradford C Lister and Andres Garcia, claimed that a rapid decline in insect populations in a rainforest in Puerto Rico was the result of rising temperatures. The Washington Post called the study “hyperalarming”, while the Guardian discussed climate change causing “insect collapse”.
However, the authors’ evidence that temperatures had, in fact, risen turns out to be based on a single weather station, which was known to be unreliable because of undocumented changes to equipment and location resulting in a substantial and abrupt increase in recorded temperatures in September 1992.
Since 1992, temperatures at this station have actually declined.
According to the IPCC at least 77%, but more probably 120%, and up to 200% of the observed warming, has been caused by GHGs.
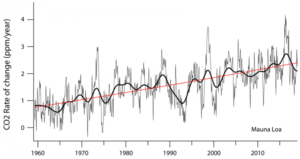
The rate of CO2 change (the atmospheric increase in CO2 every year) has been increasing almost linearly since 1959 and is currently ~2.4 ppm/year.
…
Figure 2. Mauna Loa rate of increase in CO2 (ppm/year). Thin line, 12-month increase. Thick line, gaussian smoothing. Red line, 2nd order polynomial least-squares fit to the yearly increase.
2018 was the fourth warmest year of the instrumental period (started 1850) having a temperature anomaly of 0.91 +/- 0.1 °C – cooler than 2017 and closer to the fifth warmest year than the third. But of course there are those that don’t like to say the global surface temperature has declined.
Study shows that Vikings enjoyed a warmer Greenland
Chemistry of bugs trapped in ancient lake sediment shows a warm climate at a key time in Greenland’s history
Although TV and movies paint Vikings as robust souls, braving subzero temperatures in fur pelts and iron helmets, new evidence indicates they might have been basking in 50-degree summer weather when they settled in Greenland.
After reconstructing southern Greenland’s climate record over the past 3,000 years, a Northwestern University team found that it was relatively warm when the Norse lived there between 985 and 1450 C.E., compared to the previous and following centuries.
When Thomas Edison established his Pearl Street power plant in New York City in 1892, he used coal for fuel, not wood. Wood fuel could not compete with the cost of coal in 1892 and it still can’t today. Nevertheless, burning of biomass is widely regarded as sustainable and promoted as a solution for climate change, especially in Europe.
Today, Europe produces about 17 percent of its energy and 29 percent of its electricity from renewable sources. Biomass accounts for about 19 percent of the electricity generated from renewables. Since 2000, Europe’s biomass consumption for energy production is up 84 percent.
For example, biomass fuel produced 18 percent of Denmark’s electricity in 2017. For the last two decades, Denmark has been reducing coal-fired power plant output, but adding biomass-powered plants. Since 2000, Denmark’s use of coal fuel for electricity decreased 63 percent. But the use of biomass fuel for electricity in Denmark increased by a factor of five, almost exactly replacing the decline in coal output. About three-quarters of the biomass consumed by Denmark is wood, with most of it imported.
Another year, another claim of “hottest” or “warmest years.” So-called “Hottest year” claims are purely political statements designed to persuade the public that the government needs to take action on man-made climate change. Once again, the media and others are hyping temperature changes year-to-year so small as to be within the margin of error.
Such temperature claims are based on year-to-year temperature data that differs by only a few hundredths of a degree to up to a few tenths of a degree—differences that were within the margin of error in the surface data.
Here are the AP’s and NASA’s claims out today: (A full debunking of these “hottest year”claims follows below.)
Ever since Darwin first set foot on the Galapagos, evolutionary biologists have long known that the geographic isolation of archipelogos has helped spur the formation of new species.
Now, an international research team led by Theresa Cole at the University of Otago, New Zealand, has found the same holds true for penguins. They have found the first compelling evidence that modern penguin diversity is driven by islands, despite spending the majority of their lives at sea.
“We propose that this diversification pulse was tied to the emergence of islands, which created new opportunities for isolation and speciation,” said Cole.
Over the last 5 million years, during the Miocene period, (particularly within the last 2 million years), island emergence in the Southern Hemisphere has driven several branches on the penguin evolutionary tree, and also drove the more recent influence of human-caused extinctions of two recently extinct penguin species from New Zealand’s Chatham Islands.
Climate-driven changes in phytoplankton communities will intensify the blue and green regions of the world’s oceans
From the Massachusetts Institute of Technology
Climate change is causing significant changes to phytoplankton in the world’s oceans, and a new MIT study finds that over the coming decades these changes will affect the ocean’s color, intensifying its blue regions and its green ones. Satellites should detect these changes in hue, providing early warning of wide-scale changes to marine ecosystems.
Writing in Nature Communications, researchers report that they have developed a global model that simulates the growth and interaction of different species of phytoplankton, or algae, and how the mix of species in various locations will change as temperatures rise around the world. The researchers also simulated the way phytoplankton absorb and reflect light, and how the ocean’s color changes as global warming affects the makeup of phytoplankton communities.
The researchers ran the model through the end of the 21st century and found that, by the year 2100, more than 50 percent of the world’s oceans will shift in color, due to climate change.
China’s coal mine methane regulations have not curbed growing emissions
Abstract
Anthropogenic methane emissions from China are likely greater than in any other country in the world. The largest fraction of China’s anthropogenic emissions is attributable to coal mining, but these emissions may be changing; China enacted a suite of regulations for coal mine methane (CMM) drainage and utilization that came into full effect in 2010. Here, we use methane observations from the GOSAT satellite to evaluate recent trends in total anthropogenic and natural emissions from Asia with a particular focus on China. We find that emissions from China rose by 1.1 ± 0.4 Tg CH4 yr−1 from 2010 to 2015, culminating in total anthropogenic and natural emissions of 61.5 ± 2.7 Tg CH4 in 2015. The observed trend is consistent with pre-2010 trends and is largely attributable to coal mining. These results indicate that China’s CMM regulations have had no discernible impact on the continued increase in Chinese methane emissions.
La stratégie des anciens président iranien et vénézuélien – Ahmadinejad et Chavez comme Maduro à sa suite – qui rêvaient de mettre à genoux les États-Unis grâce à leurs réserves de pétrole, a lamentablement échoué. Qui plus est, l’Iran et le Venezuela ne sont pas des pays où il fait bon vivre…
New findings from an international ocean observing network are calling into question the long-standing idea that global warming might slow down a big chunk of the ocean’s “conveyor belt.” The first 21 months of data from sensors moored across much of the North Atlantic are giving new insight into what controls the strength of the Atlantic Meridional Overturning Circulation, a system of currents that redistributes heat around much of the Western Hemisphere.
A paper very worth reading from the USA from January 2019 in Science (Geoffrey Gebbie of the Woods Hole Oceanographic Institution/Peter Huybers of Harvard University, hereinafter GH19) is titled “The Little Ice Age and 20th-century deep Pacific cooling”.
It shows fascinating science.
The authors evaluated temperature measurements made in the deep sea by the famous expedition of the “HMS Challenger” in the 1870s. The ship sailed the Atlantic and Pacific, and probably provided the first data on the oceans down to depths of over 2000 meters. The recalibration of the old data alone is a work of art! What the paper found: The Pacific down in depths has cooled from 1870 to today, the Atlantic not.
by Kevin Murphy in Judith Curry, January 28, 2019 in ClimateEtc.
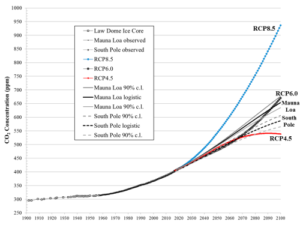
A response to: “Is RCP8.5 an impossible scenario?”. This post demonstrates that RCP8.5 is so highly improbable that it should be dismissed from consideration, and thereby draws into question the validity of RCP8.5-based assertions such as those made in the Fourth National Climate Assessment from the U.S. Global Change Research Program.
Analyses of future climate change since the IPCC’s 5th Assessment Report (AR5) have been based on representative concentration pathways (RCPs) that detail how a range of future climate forcings might evolve.
Several years ago, a set of RCPs were requested by the climate modeling research community to span the range of net forcing from 2.6 W/m2 to 8.5 W/m2 (in year 2100 relative to 1750) so that physics within the models could be fully exercised. Four of them were developed and designated as RCP2.6, RCP4.5, RCP6.0 and RCP8.5. They have been used in ongoing research and as the basis for impact analyses and future climate projections.
…
Figure 2. History and forecasts of CO2 concentration. RCP8.5 is defined by 936 ppm in 2100.
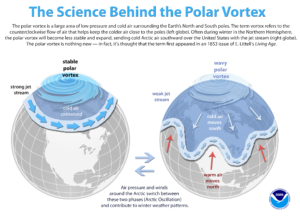
Charismatic Swiss meteorologist Jörg Kachelmann posted a comment at Twitterwhere he wondered what flagship German ZDF television was thinking when its evening news announced the polar vortex was some sort of new phenomenon arising from global warming.
Recently in the media we’ve been hearing a lot about the junk science that a warmer Arctic is somehow miraculously producing extreme cold over vast neighboring continents.
NOAA: “Polar vortex nothing new […] term appeared in 1853”
…
The science behind the polar vortex.(NOAA)Download
…
La géologie, une science plus que passionnante … et diverse

 I
I