by P. Gosselin, Aug 8, 2024 in NoTricksZone
Pacific typhoons forming in the month of July have been trending downward for 70 years
The Japan Meteorological Agency (JMA) presents the latest data for Pacific typhoons — going back to 1951.
Although bad weather happens all the time, climate alarmists are desperate for weather extremes, searching across the internet in order to produce some headlines – thus hoping to keep the hoax going. Unfortunately they won’t find much in terms of typhoons forming in the Pacific.
July trend down
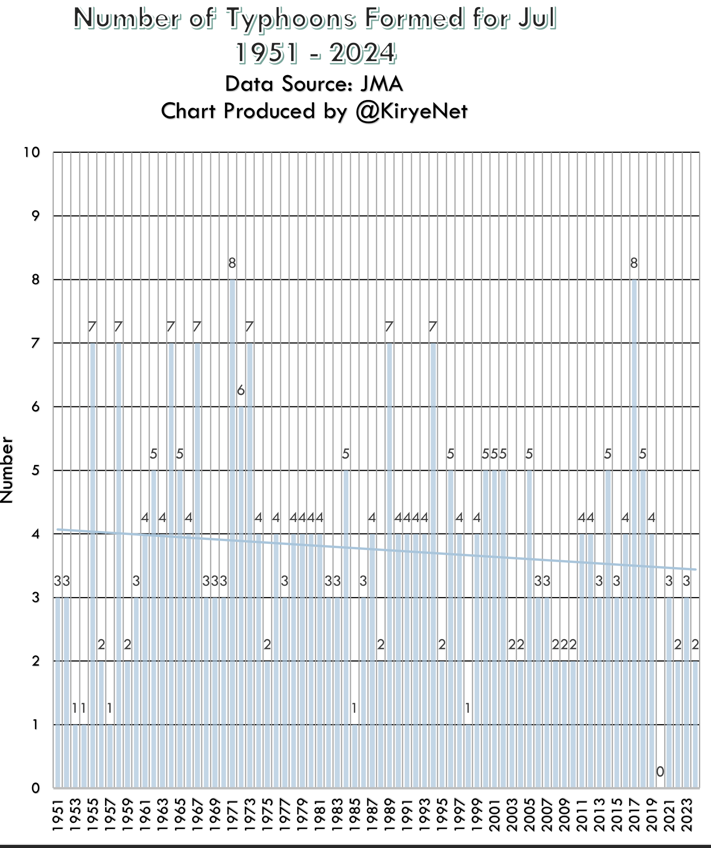
Today we look at the data from the Japan Meteorological Agency (JMA) for the number of typhoons formed in the Pacific in the month of July, now that the July data are available:
Data source: JMA.
…
by P. Gosselin, March 1, 2023 in NoTricksZone
The December 1 to February 28 so-called meteorological winter has just ended and the latest data for the mean winter temperature are available for Tokyo and its island Hachijō-jima.
Tokyo winters have been cooling since 1984
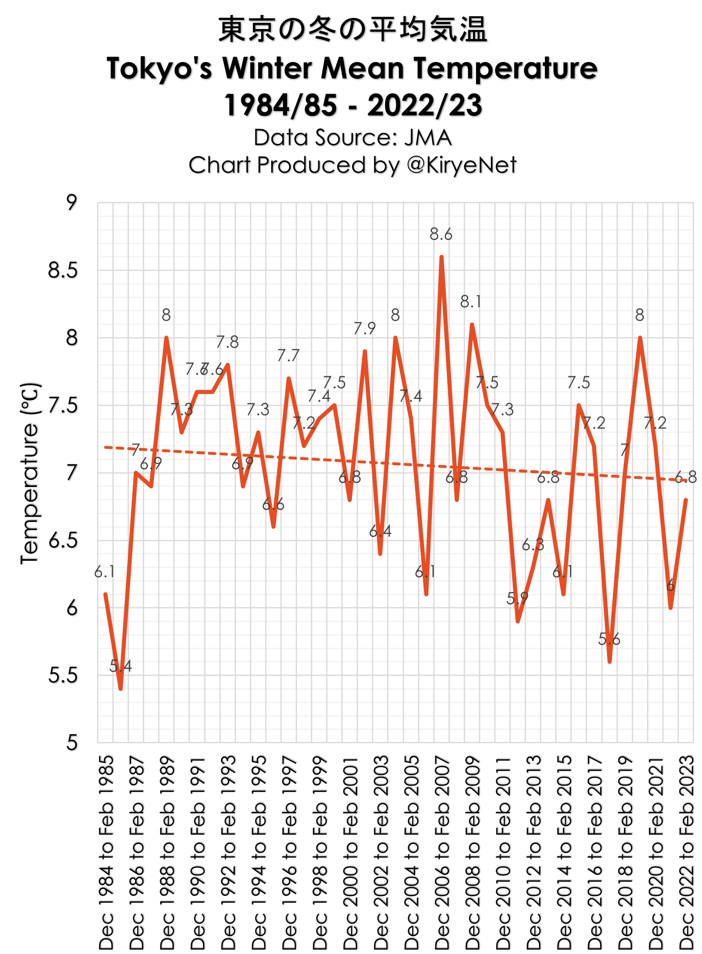
With all the news about global warming, surely the decades long winter-trend for the city of Tokyo must be one of strong warming. Yet, looking at the mean DJF winter temperature trend for Tokyo going back 39 years using the untampered data from the Japan Meteorological Agency (JMA), we see a trend that has to surprise the global warming bedwetting dolts:
Data source: JMA.
As the chart shows, instead of warming, winters in Tokyo have been cooling (modestly) since the global warming scare began in the 1980s. The average of the last 10 years have definitely been colder than the two preceding ten-year periods. Citizens in Tokyo who have been hearing warming doom for decades have in fact not experienced it. Where’s the warming?
….
by P. Gosselin, Jan 25, 2023 in NoTricksZone
TOKYO HAS COOLED OVER THE PAST 30 YEARS.
Hachijō-jima island hasn’t seen any climate change in decades!
Charts by Kirye
The mean temperature data for December, 2022, for the city of Tokyo, Japan and its Hachijō-jima island in the Pacific are now available from the Japan Meteorological Agency (JMA).
These data now allow us to look at the newest annual mean temperature trends for the two locations.
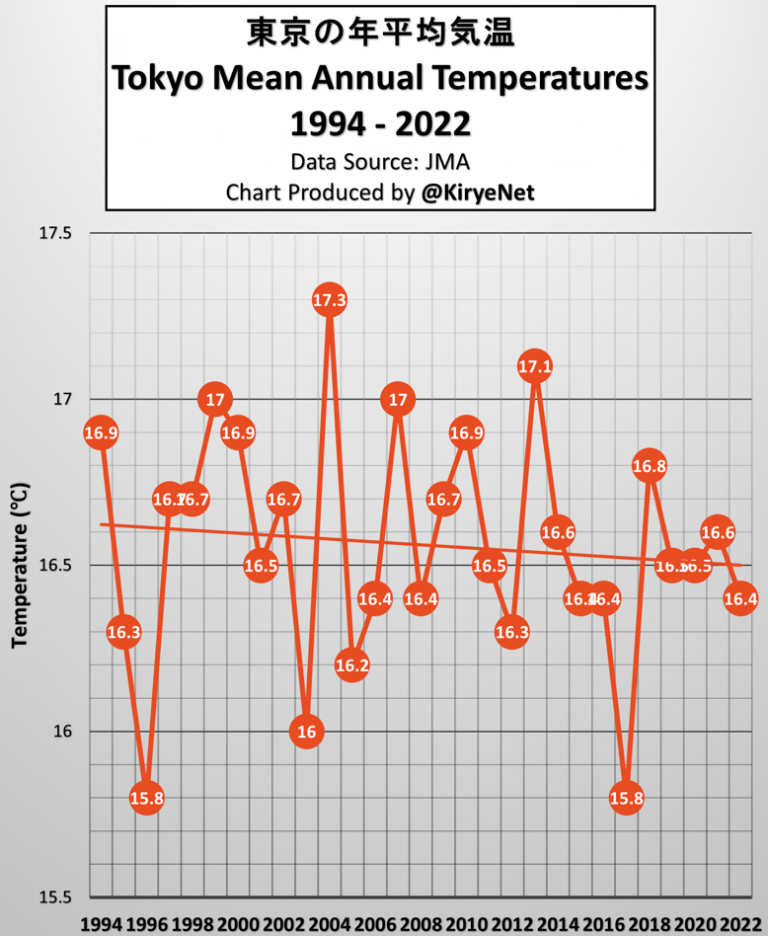
First we look at latest annual mean temperature plots for Tokyo since 1994:
Data: JMA.
According to the alarmists, the increase in CO2 is supposed to be heating up the entire planet. Strangely, using data from the JMA, Tokyo has in fact cooled modestly since 1994 – despite the urban heat sink effect from all the concrete, asphalt, steel and waste heat.
…
by P. Gosselin, Aug 6, 2022 in NoTricksZone
Pacific typhoons have been trending downward for 70 years
The Japan Meteorological Agency (JMA) presents the latest data for Pacific typhoons — going back to 1951.
This summer climate alarmists in Europe have been chasing “heat waves”, likely because hurricanes and typhoons have been on the quiet side.
Today we look at the data from the Japan Meteorological Agency (JMA) for the number of typhoons formed in the Pacific in the month of July, now that the July data are available:
…
Clearly the world has warmed somewhat since 1951, but contrary to what the climate bedwetters claim, the trend in typhoons has been downward – suggesting that a warmer climate leads to less Pacific storms in terms of typhoons formed. This is the opposite of what climate “experts” said would happen.
Next we look at the number of typhoons formed in the Pacific from January to July, going back to 1951:
…
by Kyrie, Aug 3, 2022 in NoTricksZone
Continuously increasing CO2 emissions into the atmosphere from the burning of fossil fuels is supposed to be causing warming all over the globe right now, so we should be seeing it in most of the trends.
But often we don’t. The globe, in fact, has cooled somewhat since the El Nino of 2015/16. The media refuse to report that.
One example of no warming is the midsummer mean for Tokyo and its rural Hachijojima island in the Pacific.
Tokyo
Looking at the July mean temperature trend for Tokyo itself, using data from the Japan Meteorological Agency (JMA), and not the adjusted datasets from NASA, we have the following:
…
by P. Gosselin, Mar 4, 2022 in NoTricksZone
The February and winter 2021/22, untampered JMA mean temperature data are in for Tokyo and its Hachijojima island
Tokyo
Here’s the latest plot of February mean temperatures for Tokyo, since 1987
…
Over the past 34 years, February mean temperatures in Tokyo have been steady, i.e. no warming. After the past 2 Februarys came in rather balmy, this most recent February has been the coldest since 1988!
Hachijojima
Moving away from the urban Tokyo and over to the city’s rural Pacific island of Hachijojima, some 275 km off the Japan mainland, we plot the latest February data going back to 1987
…
Here as well there’s been no warming in February since 1987. In contradiction to the predictions of warming, the island has in fact cooled off bit, according to the data from the Japan Meteorological Agency (JMA).
The past February has been among the coolest since 1987.
by P. Gosselin, Jan 22, 2021 in NoTricksZone
I’ve compiled a list of six examples how the sun impacts climate across the globe.
1. Climate periods based on a double Hale (44-45 years) cycle of solar activity.
In 1977 Australian geologist Rhodes W. Fairbridge found a 45-year periodicity of beach ridge located at the Hudson Bay. It has been formed with storms in Hudson Bay caused by a wavier jet stream.
I have found a 44-year periodicity of heavy snowfall in Japan caused by the wavier jet stream as follows. The time series coincide quite well with that of Fairbridge (1977).
1833 Tempo famine, Dalton minimum (1795-1830)
1877 Seinan war (44 years later)
1918 Rice riot, Gleissberg minimum (1898-1923) (41 years later)
1963 38 heavy snowfall (45 years later)
2006 Heisei 18 year heavy snowfall, Gleissberg or Dalton minimum (43 years)
The climate history of 20th century can be divided with the following 5 periods based on the double Hale cycle above using aa-index of geomagnetism associated with solar activity. The Pacific Climate Shift occurred at 1977 with solar activity increase & a positive PDO index.
1900-1918: Little Ice Age (LIA)
1919-1962: 1st Modern Warm Period (1st MWP)
1963-1976: Temporal Cold Period (TCP, New Ice Age Coming, see below)
1977-2005: 2nd Modern Warm Period (2nd MWP)
2006 – present: New Cold Period (NCP)
…
by Cap Allon, Jan 23, 2021 in Electroverse
Following the historic snowstorms of the past few weeks, Japan has been hit again: at least 13 people died and more than 250 were injured as record snowfall blanketed regions along the Sea of Japan coast, according to the latest report by the nation’s Disaster Management Agency.
Among those to have lost their lives were three people in Fukui Prefecture, and four in Niigata Prefecture, all reportedly while trying to remove the snow which topped a whopping 3.13 meters (10.3 feet) in some areas.
According to Japan’s Meteorological Agency (JMA), at least 10 monitoring stations along the Sea of Japan set new all-time 72-hour snowfall records late on Jan. 10, and many more busted all-time low temperature records, including in Furue, Kamigoori, and Kuzakai–with the latter logging a bone-chilling -24C (-11F).
…
by P. Gosselin, Sep 26, 2020 in NoTricksZone
Today, according to government scientists, CO2 is supposed to be the dominant climate driver, overwhelming all the other power natural forces such as solar variability and oceanic cycles.
Map (right): JMA
Yet when we compare (untampered) datasets, we often find surprising parallels and underlying correlations with these now ignored natural factors, which tell us CO2 isn’t what the activists want us to believe it is and that things are really much messier than the simplistic CO2-temperature correlation.
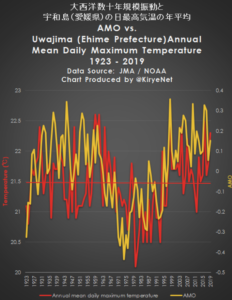
Today we look at a plot of the annual mean daily maximum temperature from Uwajima, Japan, together with the plot of the Atlantic Multidecadal Oscillation (AMO) going back almost 100 years.
Data: http://data.jma.go.jp/… / https://psl.noaa.gov/data
Of course, nothing in a complex system like climate is going to show a perfect correlation, yet the above general fit is quite remarkable, which thus suggests regions are climatically interconnected in many yet to be understood ways. Such things aren’t accidental.
In summary: climate science is far from being understood, let alone settled. Anyone suggesting otherwise is likely just trying to sell you a bridge in Brooklyn – or they simply don’t know much about the subject and only parroting media sound bites.
by Hiroko Tabuchi, February 5, 2020 in TheNewYorkTimes
It is one unintended consequence of the Fukushima nuclear disaster almost a decade ago, which forced Japan to all but close its nuclear power program. Japan now plans to build as many as 22 new coal-burning power plants — one of the dirtiest sources of electricity — at 17 different sites in the next five years, just at a time when the world needs to slash carbon dioxide emissions to fight global warming.
…
by Kirye, January 9, 2020 in NoTricksZone
Though the media like to tell their audience that man-made climate change is leading to more extreme weather, the data don’t support it. In fact, one could easily argue that Japan’s climate is more agreeable today.
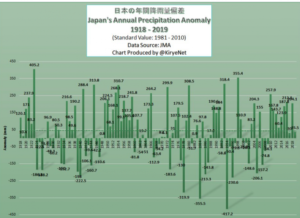
No trend in long-term annual precipitation
Over the past 100 years, for example, annual precipitation has not trended in an particular direction over the long term, showing rather some cyclical attributes:
Data source: Japan Meteorological Agency (JMA).
If anything, precipitation has been rather steady for the better part of the past 2 decades, and even resembles what was observed about 60 years ago, in the 1950s.
Note how the extremes in precipitation occurred in the 1970s and 1980s when most of the climate talk was about global cooling. But overall, there’s been no trend change in precipitation in Japan.
Typhoons trending downward modestly!
…
by P. Gosselin, February 17, 2019 in NoTricksZone
Today any warming found anywhere almost always gets blamed on heat supposedly getting trapped by rising atmospheric CO2 concentrations. Moreover, activist scientists insist we ignore all other powerful factors such as solar and oceanic cycles.
In fact these activists have become so extreme that they insist that record cold today is caused by warming.
But as people learned already in the first grade, the earth’s surface warms when the sun shines on it, and tends to cool when clouds obstruct the sun.
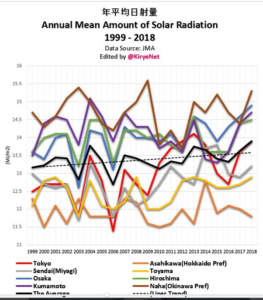
Solar radiation at the surface has risen over the past decades
In Japan, the Japanese Meteorology Agency (JMA) has 8 stations that measure solar radiation reaching the surface, and many other for recording temperature.
Data from the 8 stations recording solar radiation are plotted since 1999 (i.e. 20 years) as follows:
Data source: JMA
by Albert Parker, March 1, 2019 in Ocean&CoastalManagement
Highlights
- • Japan has strong quasi-20 and quasi-60 years low frequencies sea level fluctuations.
- • These periodicities translate in specific length requirements of tide gauge records.
- • 1894/1906 to present, there is no sea level acceleration in the 5 long-term stations.
- • Those not affected by crustal movement (4 of 5) do not even show a rising trend.
- •Proper consideration of the natural oscillations should inform coastal planning.
…
See also here
by Kirye and P. Gosselin, August 17, 2018 in NoTricksZone/JapanMeteorologicalAgency
Aerial photos show that the 15 temperature observation stations the JMA is using to determine mean temperature anomalies are likely impacted far more by urbanization than the agency claims.
…
…
Abashiri is in the middle of buildings and streets.
by P. Gosselin, June 01, 2018 in NoTricksZone
The Global Environment and Marine Department of the Japanese Meteorological Agency recently corrected the long term trend in the annual mean sea ice extent in the Antarctic area: from 0.015 x 10⁶ km2per year to 0.019 x 10⁶ km2 per year on 11 May 2018.
That’s more than a 25% adjustment (15,000 sq. km to 19,000 sq km). So while chunks the size of Manhattans may break off from time to time, about 300 Manhattans of new ice gets added annually.
The report notes that in the Antarctic Ocean: “the annual maximum and annual mean sea ice extents have shown a long-term trend of increase since 1979”.
(…)
by Nicola Jones, January 11, 2011 in Nature
Corals around Japan are fleeing northwards, according to a new study. One type has been spotted ‘sprinting’ at 14 kilometres a year, thanks to a lift from ocean currents. That means ocean ecosystems could shift rapidly in the face of climate-change impacts such as warming seas, the authors say.
…
by Anthony Watts, April 22, 2018 in WUWT
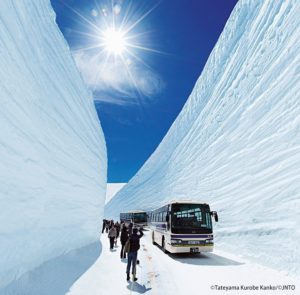
You think we had a bad winter here in the USA? Look at Japan where they have walls of snow 56 feet tall (almost the height of a 6-story building).
There’s an avalanche of tourists coming to the Tateyama to see the walls of snow.
Source: http://www.lugaresdenieve.com/?q=es/noticia/alud-turistas-tateyama-para-ver-paredes-nieve-17-metros-altura
It has been a rough winter full of snow all over the northern hemisphere, as this newest NOAA-20 satellite image shows
(…)
by P. Gosselin, April 20, 2018 in NoTricksZone
I’ve been regularly bringing you climate and energy news from Germany, with Kenneth in USA posting on the latest science.
Now NoTricksZone is happy to report we are also working with skeptic Japanese climate blogger Kirye, who runs KiryeNet. This means we’ll also be occasionally presenting skeptic news out of Japan in English.
For example in last Tuesday’s post Kirye delivered the key parts on the Arctic Freezamageddon. Our aim is to provide more of such posts in the future.
Views from other countries like Japan are always extremely useful. There really isn’t any global climate science consensus. It’s fraudulent to claim that there is.
by P. Gosselin, April 7, 2018 in NoTricksZone
If you haven’t already picked up a copy of the The Politically Incorrect Guide to Climate Change, please do get your hands on one.
According to its author Marc Morano, people have been snatching them up and a third printing has started. The book even made the Amazon top 100 best selling books for awhile.
It also ranked first in a number of categories. In his book, NoTricksZone gets mentioned 4 times and even took up one full page at one spot!
So now on to today’s post…
La géologie, une science plus que passionnante … et diverse