The anatomy of past abrupt warmings recorded in Greenland ice

by C. Rotter, Apr 19, 2021 in WUWT/Nature


New paper at Nature Communications

Abstract

Data availability and temporal resolution make it challenging to unravel the anatomy (duration and temporal phasing) of the Last Glacial abrupt climate changes. Here, we address these limitations by investigating the anatomy of abrupt changes using sub-decadal-scale records from Greenland ice cores. We highlight the absence of a systematic pattern in the anatomy of abrupt changes as recorded in different ice parameters. This diversity in the sequence of changes seen in ice-core data is also observed in climate parameters derived from numerical simulations which exhibit self-sustained abrupt variability arising from internal atmosphere-ice-ocean interactions. Our analysis of two ice cores shows that the diversity of abrupt warming transitions represents variability inherent to the climate system and not archive-specific noise. Our results hint that during these abrupt events, it may not be possible to infer statistically-robust leads and lags between the different components of the climate system because of their tight coupling.

Extremest Weather 2020

by Ralph Alexander, April 2021 in GWPF


Contents

About the author iii Executive summary v 1. Introduction 1 2. Natural disaster analysis 2 3. Heatwave 6 4. Cold extremes 12 5. Drought 14 6. Precipitation and floods 16 7. Hurricanes 19 8. Tornadoes 23 9. Wildfires 26 10. Conclusions 31 Notes 33 Review process 38 About the Global Warming Policy Foundation 38

About the author

Retired physicist Dr. Ralph B. Alexander is the author of Global Warming False Alarm and Science Un- der Attack: The Age of Unreason. With a PhD in physics from the University of Oxford, he is also the author of numerous scientific papers and reports on complex technical issues. His thesis research in the interdisciplinary area of ion-solid interactions reflected his interest in a wide range of scien- tific topics.

Dr Alexander has been a researcher at major laboratories in Europe and Australia, a professor at Wayne State University in Detroit, the co-founder of an entrepreneurial materials company, and a market analyst in environmentally friendly materials for a small consulting firm.

ENGLAND’S COLDEST APRIL SINCE 1922, GERMANY’S CHILLIEST SINCE 1917

by Cap Allon, Apr 20, 2021 in Elecroverse


It may be late-April, but spring 2021 is a no show across much of Europe.

The continent is suffering a climatic reality similar to that of the previous prolonged spell of reduced solar output: not since the Centennial Minimum (1880-1920) have Europeans suffered an April this cold and snowy.

ENGLAND’S COLDEST APRIL SINCE 1922

Despite the cherry-picking, the UHI-sidestepping, and the unrelenting propaganda, the British Isles simply won’t heat up — the UK’s agenda-shoveling Met Office has admitted as much themselves.

Recently, one of the Met Office’s key data sets revealed that the 2010s actually came out cooler than the 2000s — a fact that goes against ALL mainstream logic: we were told average temperatures would rise “linearly,” always up and up and up on an endless march to catastrophe if no poverty-inducing action was taken…

The Central England Temperature record (CET) measures the monthly mean surface air temperatures for the Midlands region of England. It is the longest series of monthly temperature observations in existence anywhere in the world, with data extending all the way back to the year 1659.

The CET’s mean reading for April, 2021 (to the 18th) is sitting at just 5.8C — that’s 1.5C below the 1961-1990 average (the current standard period of reference for climatological data used by the WMO–an historically cool era btw), and ranks as the coldest April since 1922, and the 18th coldest since records began 362 years ago.

GERMANY’S CHILLIEST SINCE 1917

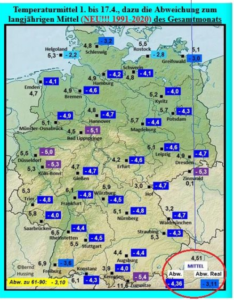
With a mean temperature just of 4.5C, Germany is faring even worse than England — it is on for second coldest April since records began in 1881, and its coldest since 1917, according to German DWD national weather service records.

The following chart shows Germany’s mean temperature anomalies (through the 17th) — it’s been anomalously cold across the entire country:

..

Hansen’s 1988 global-warming prediction was thrice observation

by C. Monckton of Brenchley, Apr 21 , 2021, in WUWT


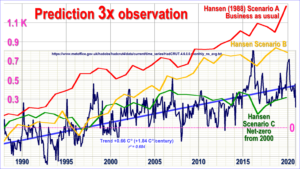
James Hansen is often debited with having stirred up so much alarm with his notorious 1988 prediction of runaway global warming in front of the U.S. Senate that IPeCaC was hastily founded later that year, so as to Save The Planet.

His prediction ran to 2020. How, then, did fantasy-land compare with more than two decades of sober, observed reality? The graph, zeroed so that the 1988 HadCRUT4 observed anomaly lies between Hansen’s three scenarios, shows that observed warming was closest to Hansen’s Scenario C.

However, the assumption underlying Scenario C is that everyone would be so scared following Hansen’s Senate testimony that what is now called “net-zero” would be achieved by 2000. Well, it wasn’t. And it won’t be, even by 2050. The chief reason is discernible in the Texas electricity grid collapse.

The Lone Star State, which ought to have had more common sense, decided that once it had carpeted the state with windmills (14th-century technology to fail to solve a 21st-century non-problem) and solar panels (produced by slave labor in China) it could reduce its dispatchable thermal grid capacity.

However, as any grid manager will tell you, you can’t do that. Not the least of the reasons why unreliables are so cripplingly expensive is that it is necessary to maintain the entire pre-existing grid regardless of how many unreliables are bolted on to it. Unreliables, therefore, inflict not only a deadweight cost but also a deadweight surplus capacity to the grid, to say nothing of the costly instability caused by giving unreliables precedence over thermal in meeting demand.