The Battery Storage Delusion.. what 35 million tons of industrial effort buys you

by Dr L. Schernikau, Aug 21, 2025 in WUWT


Details inc Blog at www.unpopular-truth.com

As someone who has spent most my professional life in the global energy and commodities space both as an economist and as a trader, I have grown increasingly concerned about the way grid-scale battery storage is portrayed in public discourse. If you have paid any attention to the headlines, you would have heard that battery technology is “on the verge of solving” the intermittency problem of wind and solar energy. According to this narrative, all we need to do is build more battery storage, and the path to “net zero” will unfold automatically… magically.

If only it were that simple…

In my latest blog post Pros and Cons of Utility-Scale Battery Storage I unpack the many assumptions behind this belief. The facts I present may be unpopular, but they are grounded in physics, not politics.

Here a couple of key points that I feel might spark some interest.

35 million tons of raw materials for a couple of hours…

To build a 50 GWh utility-scale lithium-ion battery system (approx. annual output of a Gigafactory), which has the ability to store electricity, for a city like New York, for only a few hours, you need ~ 35 million tons of raw materials (~ 700,000 t per GWh). That roughly covers the mining, upgrading, transport, and processing of ores like lithium, cobalt, nickel, graphite, iron ore, bauxite, and others.

Think about it like this…a 1-ton utility-scale battery has a storage capacity of around 100 kWh and requires ~ 70 tons of mined, processed, and manufactured raw materials to be manufactured. This is the energy equivalent of about ~40 kg of coal or ~20 litres of oil.

Let that sink in: 70 tons of mining and industrial processing to store what coal already provides in a (40kg) bag, small enough to be carried by hand.

Media Championed Study Overstating Climate Damages, Went Radio Silent As Major Flaws Emerged

by K. Killough, Aug 20, 2025 in ClimateChangeDispatch


Typhoon flooding aftermath
When a study published last year in the peer-reviewed journal Nature found that climate change would cost the globe $38 trillion per year by 2050 — ultimately reducing GDP by 19% over the next 24 years — many media outlets were quick to jump on it. [emphasis, links added]

“Climate change will make you poorer,” CNN warned. The Guardian reported on the study under the headline, “Climate crisis: average world incomes to diminish by nearly a fifth by 2050.”

Reuters and Forbes also carried articles on the study, and the Associated Press reported that “New study calculates climate change’s economic bite will hit about $38 trillion a year by 2049.”

According to the activist publication Carbon Brief, only one other study received more mentions in the media in 2024.

However, the study — referred to as “the Potsdam study” — has since been found to have serious flaws.

When these are corrected, according to the researchers who uncovered the problems, it reduces the study’s estimate of climate “damages” through 2100 by two-thirds. This means the estimates aren’t statistically different from zero.

The study has been cited by organizations influencing policy across the globe, including the World Bank, the Organization for Economic Co-operation and Development, and the U.S. Congressional Budget Office. Sen. Sheldon Whitehouse, D-R.I., cited the study last yearand again in July — both times entering the study into the Congressional Record.

While The Washington Post reported on the errors, none of the other outlets have so far revisited the story.

Flaws called “devastating” to the paper’s conclusions


The DOE climate report: a scientific milestone that Europe does not want to see

by Clintel Foundation, Aug 13, 2025


In July, the U.S. Department of Energy (DOE) published a groundbreaking document: A Critical Review of Impacts of Greenhouse Gas Emissions on the U.S. Climate. At the request of Energy Secretary Chris Wright, five leading scientists provided a clear and well-founded overview of climate science, finally paying explicit attention to uncertainties, alternative insights, and factual observations. The authors are not bloggers or activists, but internationally recognized researchers with decades of expertise in climate science, meteorology, economics, and physics. [See the box at the bottom of this article for their credentials].

Sober, well-founded, and without alarmism

Energy Secretary Chris Wright gave the researchers complete freedom in writing this report: “I exerted no control over their conclusions.” The report stands out for its clarity, objectivity, and scientific integrity.

Some key points of the report are:

  • CO₂ should no longer be seen as ‘pollution’: the report advocates a scientific review of this US position (since 2009), including recognition of the positive effect of CO₂ on crop growth.
  • Global greening: satellite images show greening of the Earth due to higher CO₂ levels.
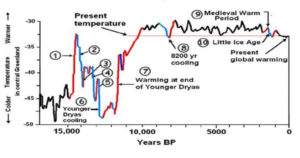
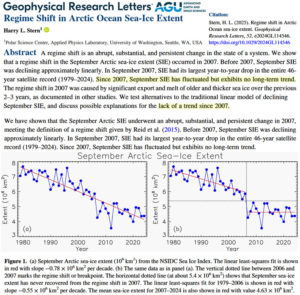
  • Models vs. observations: the discrepancies between model results and actual observations are shown. There is also more emphasis on natural climate variability.
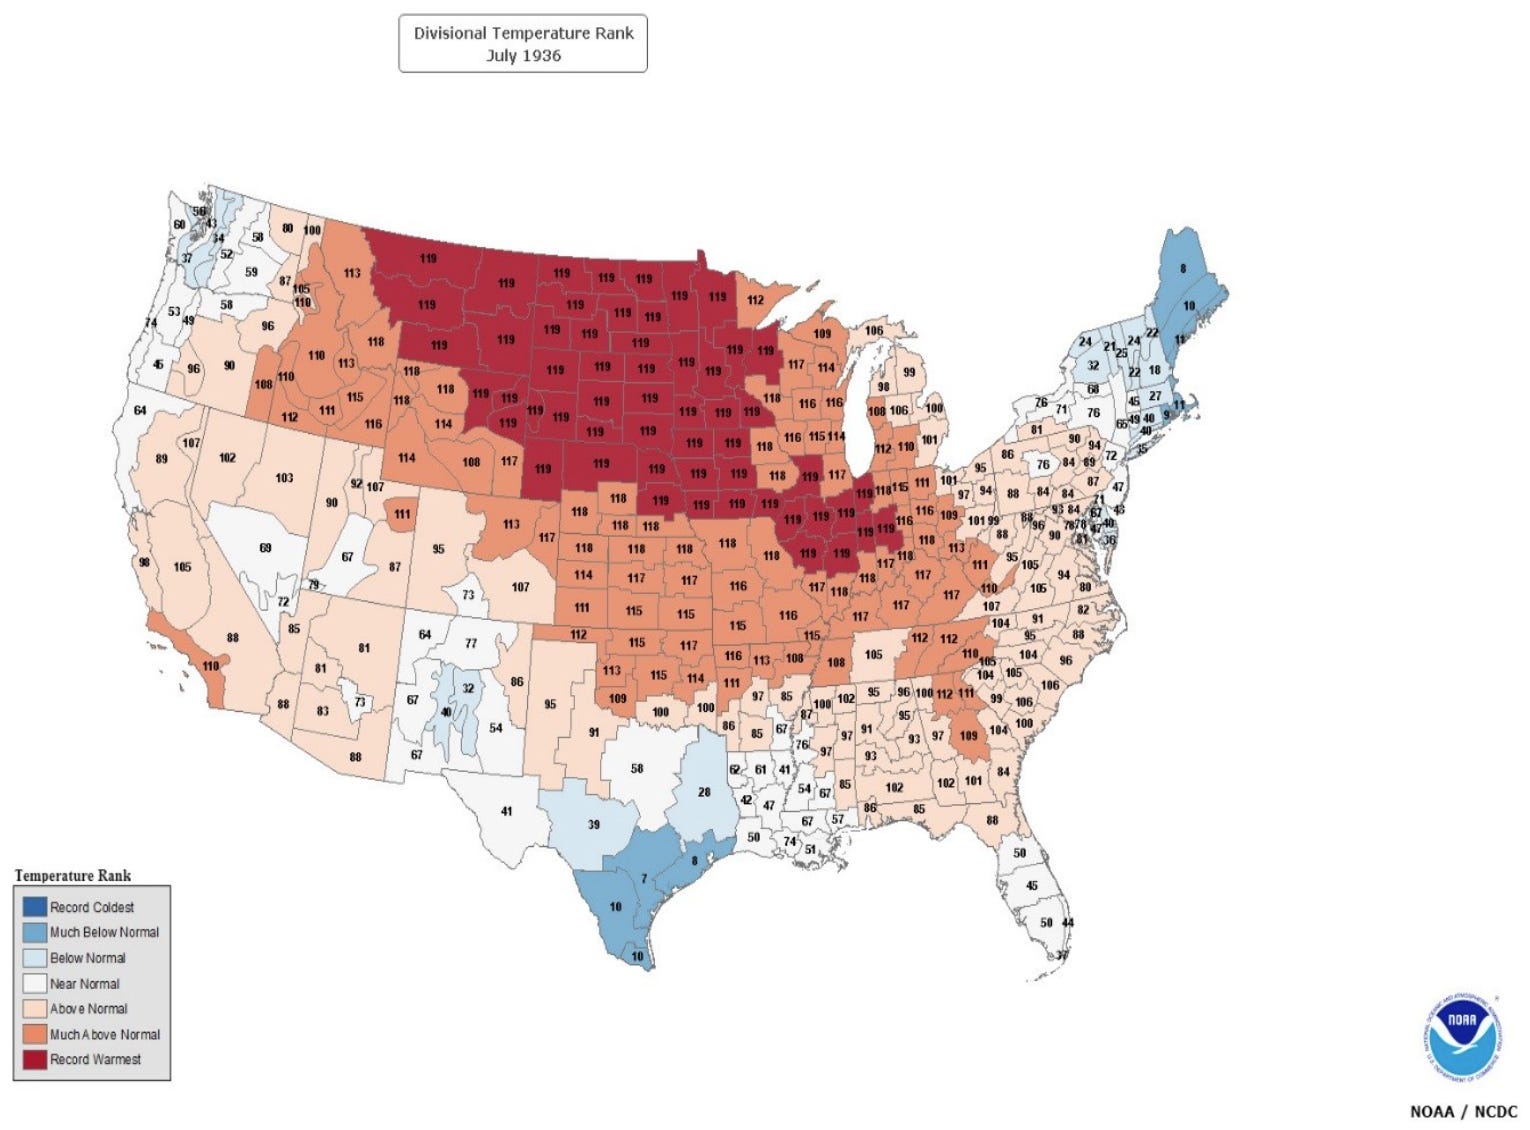
  • Weather extremes: there is no alarming increase in extreme weather conditions in the US.
  • Economic consequences: interventions on CO₂ emissions have little climate impact in the short term, but can entail high economic costs.

Reactions from Europe

The report has certainly been noticed within the US. Among others, researcher Roger Pielke Jr. devoted a widely read article to it on his Substack channels. Pielke describes the DOE report as a serious scientific text that has carefully processed sources.

This report should also have shaken Europe awake, but what happened? Complete silence. No news bulletins, no parliamentary questions, no editorial commentary. While alarmist reports are spreading like wildfire across Europe, this report is being ignored. This is not only remarkable, it is downright shocking. It casts a shadow over the intellectual honesty of the European climate debate.

Two articles on the Dutch blog Klimaatgek.nl endorse this. On August 8, DoE report and media silence (in the Netherlands) was published, noting that the report was widely discussed in US circles, but remained unseen in the Netherlands, despite its importance for the automotive, energy, and agricultural sectors, among others. Earlier, on July 30, Klimaatgek headlined: Breakthrough: revision of CO₂ vision in the US. The report is called a potential turning point in the American climate vision, something that Europe cannot ignore.

Why this is so essential for Europe

Europe is guided by a single narrative: the climate crisis is urgent and catastrophic. Those who think differently are ignored or denounced. This report does the opposite: it acknowledges human influence, puts it in context, highlights uncertainties, identifies the benefits of CO2, and advocates for balanced policy considerations. As mentioned, the European silence is distressing. It is not only journalistically inappropriate; it is a democratic and scientific shortcoming. The consequences are:

  • A limited public debate – the public only hears one side.
  • Democratic deficit – policy-making based on incomplete information.
  • Scientific impoverishment – essential uncertainties and alternatives disappear from view.

Time to wake up

The DOE report deserves open debate, not silence. Europe should be proud of space for scientific diversity. Anyone who truly trusts science cannot ignore this report. Clintel remains committed to increasing the visibility of this and similar contributions – not to prove itself right, but to make the conversation complete. Only with all the facts, uncertainties, and perspectives can sensible choices be made.

The Weather Stations We Never Had

by Dr M. Wielicki, Aug 11, 2025 in Clintel


A central pillar of the climate-crisis narrative is simple enough to fit on a bumper sticker… today is the hottest in human history. That line only works if you accept, without question, that we have reliable, global temperature data before satellites. We do not. What we have is a patchwork of land stations concentrated in a few developed regions, a lot of ocean guesses from ship tracks, and then, later, generous statistical infilling.

Everyone agrees the 1930s were brutally hot across the United States… the Dust Bowl was a humanitarian and ecological disaster. Crops failed, soils blew away, and heat waves killed thousands. NOAA’s own retrospectives still call out 1936 as a benchmark summer, and July 1936 remains a singular month in the U.S. record.

https://www.weather.gov/arx/heat_jul36?utm

The global map we never measured

Before 1950, most thermometers were in the United States, Europe, and parts of the British Commonwealth. Large parts of Africa, South America, the Arctic, and the Southern Ocean had little to no routine coverage. Even the NOAA-led overview of GHCN-Daily notes how the core database is a collage of many sources with varying periods of record… that is the raw material modern analyses inherit.

Now the uncomfortable part. When there are no thermometers, you either leave grid boxes blank, or you paint numbers in from far away. HadCRUT historically left many boxes blank, explicitly avoiding interpolation, which means the “global” mean depends on where you have observations. NASA’s GISTEMP goes the other direction and spreads anomalies up to twelve hundred kilometers from a station, filling the gaps with 1200 km smoothing. Those are not trivial choices, they are the ballgame.

If you overlay the 1930s anomaly map with the station density maps, you see something obvious… warm where the thermometers were numerous, cool or neutral where coverage was threadbare. A compilation of historical station distribution between 1921 and 1950 makes the same basic point… the network was sparse and badly unbalanced.

Meteorologist Debunks False Stories On Climate Change Fueling Western Washington Megafires

by C. Mass, Aug 14, 2025 in ClimateChangeDispatch 


NY Times and Seattle Times falsely claim Western Washington megafires are rising; history shows only one since 1902.

Western Washington State fire
[Last week], The New York Times ran a blatantly false story, with The Seattle Times featuring it as well.
 [some emphasis, links added]

The claim: that Western Washington will experience more “megafires” due to human-caused global warming (climate change).

Unfortunately, the writer of this story (a Washington State stringer for the NY Times) failed to examine the historical record or the best science, getting the essential facts wrong.

How do I know the writer got it wrong?

Because for the past two years, I have researched this very issue and just published a paper on this topic in the peer-reviewed literature (here). I have read every paper and report on this issue.

So exactly what did the NY Times (and the Seattle Times) get wrong?

The article defines megafires as ones that involve hundreds of thousands of acres.

How many such fires have occurred since 1900 in western Washington?

Die Welt’ Journalist Axel Bojanowski: Apocalypticism Is “A Code Of Belonging” Among Journalists

by P. Gosselin, Aug 13, 2025 in NoTricksZone 


The world is better than what the media think.

‘Die Welt’ science journalist Axel Bojanowski was recently interviewed by the online “BauerWilli” (BW) and discussed his recently released book

33 Amazing Glimmers of Hope – Why the world is better than we think,”


Bojanowski argues there is an overly negative and apocalyptic style of reporting in the media, particularly concerning climate and environmental issues.

Cult-like behavior

According to Bojanowski, predicting the end of the world has become a sign of belonging among journalists. He sees this as a counter-movement to the post-war prosperity.

Scientists Warn About Scientists’ Warnings

by W. Eschenbach, Aug 19 2025, in WUWT


Only a journalist truly committed to the ancient art of panic-clickbait could squeeze all the world’s existential dread into a headline like, “A Giant, Destructive Volcanic Eruption Is Set to Shake the World in the Coming Months, Bringing About the End of Mankind, Scientists Warn.” They’ve accompanied it with the following graphic, in case you weren’t adequately terrified.

The dead giveaway? “Scientists Warn.” Whenever you see those two words sandwiched together above the fold, you know you’re about to step into a wonderland of wild extrapolation, qualified maybes, and models run so far into the future they boomerang back with “robots take over” as the y-axis.

They start out as follows:

Study: Corals Thrived 6,000–10,000 Years Ago Amid Much Higher Seas And Warmer Temps

by K. Richard, Aug 19, 2025 in ClimateChangeDispatch 


coral reef
New research from Indonesia indicates that from about 6,000 to 10,000 years ago, when the ocean was warmer than today, coral reef growth was rapid, averaging ~6 mm per year. [emphasis, links added]

Sea levels rose rapidly from the Early to Mid-Holocene in this region, as they were up to two meters higher than today 6,000 years ago. The higher sea levels meant there was more room for coral reef growth.

As the ocean cooled and sea levels fell ~2 meters from the Mid-Holocene highstand, coral growth slowed to ~2-3 mm per year.

Today, corals are only growing at rates of ~1 mm per year, as the water depths are too low to accommodate reef expansion.

In fact, coral coverage “has declined on the flats over the last few decades,” as the “accommodation space is less than a meter at points.”

Research from the Great Barrier Reef region (e.g., Leonard et al., 2020) also indicates coral growth experienced “turn-off” periods during cold centuries (such as the Little Ice Age) with falling sea levels.

When the ocean was “~1-2°C warmer than present” and sea levels were “~1.0 meter higher than present,” this “allowed reefs to accrete uninhibited.”

Study: Ocean sediments support theory that comet impact triggered Younger Dryas cool-off

by A. Watts, Aug 13, 2025 in WUWT


Northern Hemisphere cooling 12,800 years ago generally thought to be caused by glacial meltwater; new geochemical evidence might support comet impact.

Analysis of ocean sediments has surfaced geochemical clues in line with the possibility that an encounter with a disintegrating comet 12,800 years ago in the Northern Hemisphere triggered rapid cooling of Earth’s air and ocean. Christopher Moore of the University of South Carolina, U.S., and colleagues present these findings in the open-access journal PLOS One on August 6, 2025.

During the abrupt cool-off—the Younger Dryas event—temperatures dropped about 10 degrees Celsius in a year or less, with cooler temperatures lasting about 1,200 years. Many researchers believe that no comet was involved, and that glacial meltwater caused freshening of the Atlantic Ocean, significantly weakening currents that transport warm, tropical water northward. In contrast, the Younger Dryas Impact Hypothesis posits that Earth passed through debris from a disintegrating comet, with numerous impacts and shockwaves destabilizing ice sheets and causing massive meltwater flooding that shut down key ocean currents.

However, the impact hypothesis has been less well supported, lacking any evidence from ocean sediments. To address that gap, Moore and colleagues analyzed the geochemistry of four seafloor cores from Baffin Bay, near Greenland. Radiocarbon dating suggests the cores include sediments deposited when the Younger Dryas event began. To study them, the researchers used several techniques, including scanning electron microscopy, single-particle inductively coupled plasma time-of-flight mass spectrometry, energy dispersive spectroscopy, and laser ablation inductively coupled plasma mass spectrometry.

New Study: No Decline In Arctic Sea Ice Extent – ‘No Long-Term Trend’ – Since 2007

by K. Richard, Aug 11, 2025 in NoTricksZone 


In 2007 Al Gore won a Nobel Peace prize for predicting summer (September) Arctic sea ice would “vanish” in the next 5 to 7 years, or by 2014.

Since 2007 Arctic sea ice extent (SIE) losses have ceased. Instead, the SIE trend has been stable for nearly two decades (Stern, 2025).

“Before 2007, September SIE was declining approximately linearly. In September 2007, SIE had its largest year‐to‐year drop in the entire 46‐year satellite record (1979–2024). Since 2007, September SIE has fluctuated but exhibits no long‐term trend.”


New Study Thoroughly Disassembles The CO2-Drives-Climate Assumption In One Fell Swoop

by K. Richard, Aug 15, 2025 in NoTricksZone 


Not only does CO2 have no discernible effect on climate, but any alleged anthropogenic role within the hypothetical greenhouse effect is not detectable either.

In recent decades there has been a concerted effort to assert it is “settled” science to characterize variability in the atmospheric CO2 concentration – assumed to be modulated by human activity – as the predominant factor in both climate change and the so-called greenhouse effect.

Science, however, is never truly settled.

A new Frontiers study succinctly unsettles this prevailing paradigm with surgeon-like precision. In under 20 pages the authors deliver a cogent critique of the CO2-drives-climate presumption. A few of the key points include:

• CO2 only contributes about 4-5% to the greenhouse effect, whereas water vapor and clouds contribute 95%.

• Of that 4-5% greenhouse effect contribution from CO2, just 4% of that can be attributed to human activities (i.e., fossil fuel emissions). Thus, about 96% of the 4% contribution from CO2 can be attributed to natural processes.

“WV [water vapor] and clouds (for which WV is responsible) dominate the ARE [atmospheric radiative effect], while CO2 contributes only 4-5% to it. Also, anthropogenic CO2 emissions are only 4% of the total, with the vast majority (96%) being natural. Additionally, evidence suggests that changes in temperature precede those in CO2 concentration, thus challenging the assumption that CO2 drives temperature.”

• As Fig. 10 in the study indicates, observed changes in the atmospheric CO2 concentration cannot be demonstrated to have exerted any effect in altering longwave radiation measurements, much less the surface temperature. A hypothetical doubling the CO2 concentration [NC-RAGs, or non-condensing radiatively active gases] “results in a temperature increase of zero”.

“[W]hile the role of CO2 in photosynthesis is important in biochemical terms, it becomes negligible in terms of its contribution to the surface energy balance.”

“[T]he observed increase of the atmospheric CO2 [from 300 ppm to 420 ppm] has not altered the ARE [atmospheric radiative effect or greenhouse effect] in any discernible way.”


New Study: Heatwave-Related Deaths Have Been Declining In Recent Decades

by K. Richard, Aug 4, 2025 in NoTricksZone 


Human ingenuity outpaces modern warming. 

A comprehensive new data analysis (Walkowiak et al., 2025) involving European countries finds it takes less than 18 years for humans to adapt to a 1°C increase in mean annual temperature. Consequently, exposure to excessive heat has become less and less deadly.

Supporting this conclusion, a 2018 study involving 305 locations across 10 countries (1985-2012) affirmed “a decrease in heat-mortality impacts over the past decades,” as “heat-related mortality [fractions, AFs] decreased in all countries.”

DOE Climate Report Authors Challenge Climate Consensus, Trigger Fierce Media Backlash

by K. Killough, Aug 4, 2025 in ClimateChangeDispatch 


he Department of Energy has released a climate assessment report that incorporates the conclusions of climate scientists who have long been labeled by Democrats, the media, and climate activists as “climate deniers.” [emphasis, links added]

In a statement announcing the release Tuesday of the report, Energy Secretary Chris Wright said it was part of the EPA’s proposed rule repealing the 2009 endangerment finding, which cites the report.

Wright notes in the report’s foreword that the modern world is one of unprecedented prosperity in human history, but the public is being told that “the very energy systems that enabled this progress now pose an existential threat.”

He said he commissioned the report to “encourage a more thoughtful and science-based conversation” that scrutinizes the view that fossil fuels are threatening humanity’s well-being.

The report’s coauthor, Dr. Judith Curry, president of the Climate Forecast Applications Networkand author of “Climate Uncertainty and Risk,” says on her blog that there wasn’t complete agreement among the authors, and she welcomes a robust discussion on the report’s conclusion.

However, she wrote, she didn’t expect the same kind of openness from the alarmists who have long been the primary source of science informing climate policy for the past couple of decades.

“The Michael Mann wing of the climate debate will hate this report because: the CWG [Climate Working Group] authors are reputable scientists outside of their ‘tribe.’ The Report demonstrates that Mann et al. are losing control of the climate narrative in the U.S., and because of Trump Derangement Syndrome,” Curry wrote, adding that their usual ad hominem attacks won’t be effective against the report.

More On DOE’s Report Challenging EPA Climate Claims And CO2 Alarmism

by F. Menton, Aug 4, 2025 in ClimateChangeDispatch


earth space

On July 29 — the same day that EPA initiated the process of revoking the absurd “endangerment finding” that demonizes CO2 emissions from energy production (covered at Manhattan Contrarian here) — there was another equally momentous development on the energy front at the federal government. [emphasis, links added]

On that day, the Department of Energy released a lengthy Report with the title “A Critical Review of Impacts of Greenhouse Gas Emissions on the U.S. Climate.” (Although the Report bears a date of July 23, the 29th appears to be the date when it was signed by Energy Secretary Chris Wright and officially released.)

The Report is attributed to something called the “Climate Working Group,” consisting of five prominent members of the climate skeptic community: John Christy, Judith Curry, Steven Koonin, Ross McKitrick, and Roy Spencer. Full disclosure: I know four of the five (Judith Curry is the exception), and consider two of them friends.

These are all highly competent and accomplished people, which is a dramatic contrast to the lightweights and grifters who constitute essentially all of the “mainstream” climate science community.

Most important about these five is that they are all willing to acknowledge the limitations of the knowledge possessed by the scientific community about the world’s climate.

The Report overall comes off as a fair and balanced assessment of risks and trade-offs, rather than what normally comes from climate academics and journalists, which are cheap attempts to use speculation and fake projections to scare you out of your wits.

Climate Oscillations 11: Oceanic Niño Index (ONI)

by A. May, 4 August, 2025 in WUWT


The Oceanic Niño Index or ONI is NOAA’s primarily indicator for monitoring the sea surface temperature (SST) anomaly in the critical Niño 3.4 region. It is a 3-month running mean of ERSST.v5 SST anomalies in the Niño 3.4 region, defined as 5°N-5°S and 120°W-170°W. Figure 1 shows the ONI as computed from the NOAA ERSST dataset. ERSST is a two-degree gridded dataset, so the region averaged for figure 1 is 6°N-6°S and 120°W-170°W.

Figure 1. A plot of the ONI from 1850 – 2023. The ONI 3-month smoothed anomaly must be above +0.5 for 5 months for an El Niño and below -0.5 for 5 months to be a La Niña. In between the ENSO state is neutral, as it is today.
Per convention a three-month moving average has been applied to the raw ONI data in figure 1. Sometimes you will see the ONI detrended, but the curve in figure 1 is not detrended and has an upward slope of one-half degree per century. The 3-month moving average has to exceed 0.5°C for five consecutive months to define an El Niño, so the chart is colored red above 0.5°C. The same is true for La Niña, but in reverse. The white area between -0.5 and +0.5 is ENSO neutral.

The current ENSO state, as of July 2025, is ENSO neutral, with an average ONI of about zero. NOAA prefers to use a base period for their ONI anomalies of 1991-2020, but we use 1961-1990 to be consistent with the other posts in this series and with HadCRUT5. There is a visual trend over the past 175 years, Niños are more common now and stronger than in previous years. Climate models have a very hard time duplicating ENSO over both short and long periods of time (IPCC, 2021, p. 115). The Niño 3.4 region is shown in figure 2 in red.

The battle for Ukraine’s geological wealth

by R. Stone, July 31, 2025 in Science


In late June, Russian forces advanced in the Donetsk region of eastern Ukraine, seizing another few square kilometers of ground—and a significant deposit of lithium. The loss adds to a growing tally of Ukraine’s geological riches that have fallen into enemy hands. It is also one more blow to a landmark agreement that the United States and Ukraine had signed weeks earlier, enabling U.S. firms to gain access to the nation’s mineral wealth.

Under the 30 April deal, the U.S. and Ukraine pledged to establish an investment fund to rebuild Ukraine with revenues from mineral, oil, and natural gas projects. Ukraine will maintain ownership of its natural resources, while future U.S. military aid would be deemed a contribution to the fund matched by revenue from Ukraine’s mineral wealth. But with war raging, implementation largely must wait, says Anatolii Bulat, director of the M.S. Poliakov Institute of Geotechnical Mechanics (IGTM), which is tracking the fate of the country’s mineral deposits. Without lasting peace in Ukraine or a U.S. pledge to help defend Ukraine’s mineral assets, the security situation in the country will be too unstable for a long-term investment in a mine and its supporting infrastructure, the Center for Strategic and International Studies argued in a recent briefing. It noted that such projects take an average of 18 years to complete and can cost $1 billion.

Flawed Attribution Study Falsely Blames South Africa’s Floods On Climate Change

by L. Lueken, July 31, 2025 in ClimateChangeDispatc


Durban, South Africa flood
A recent post at Phys.org claims that a recent attribution study shows that climate change made April 2022’s flooding in South Africa “significantly” worse. [emphasis, links added]

This is an unfalsifiable (not able to be proven or disproven experimentally or observationally) claim that ignores the complexities of weather and relies on distinctly unreliable computer modeling.

The article, titled “Climate change significantly worsened deadly 2022 Durban floods, study shows,” goes over an attribution study that focused on flooding in Durban, South Africa, three years ago.

Phys.org claims the study “shows that rainfall during the storm of 11–12 April 2022 was between 40 percent and 107 percent heavier than it would have been in a cooler, preindustrial climate.”

How do they know this? They don’t; rather, they claim it based on computer model outputs.

Unlike most coverage of attribution science, Phys.org vaguely hints at the fact that the modeling is less than bulletproof, explaining that the models “simulated the storm in both today’s warmed climate and a counterfactual world without human-induced global warming.”

Climate Realism has explained at length why attribution modeling is not evidence, but it may be helpful to point out that Phys.org is only half right here.

They indeed used a counterfactual world with no warming, but the warmed model is also counterfactual. A number of assumptions, some more robustly backed by available data and evidence than others, go into modeling the “current world.”

Statistician Dr. William Briggs has what I consider the best simple summary of how attribution modeling works:

Are direct water vapor emissions endangering anyone?

by Real Climate, July 31, 2025


In the EPA EF reconsideration document there is a section on p62 where they attempt to make the argument that the CO2 endangerment finding would also apply to direct water vapor emissions to the atmosphere, which is (according to them) obviously absurd. But both claims are bogus.

First off, the definition of pollutant in the Clean Air Act (CAA) clearly does include CO2 as well as water vapor. This was the point litigated in Massachusetts v. EPA in 2007:

An air pollutant is defined as any substance, or combination of substances, including physical, chemical, biological, or radioactive matter, that is emitted into or otherwise enters the ambient air and may reasonably be anticipated to cause or contribute to air pollution.

A Hazardous Substance is further defined as one “that can cause or may reasonably be anticipated to cause adverse health or environmental effects“.

So there are two factors to assess. First, is the substance emitted into the air? (Yes, for both CO2 and water vapor). Second, might it be reasonably anticipated to cause adverse effects? (This is precisely the point of the Endangerment Finding process!). Thus it is not self-evidently absurd that water vapor emissions might be regulatable under the CAA, but the issue is whether there is any evidence that these emissions might plausibly have adverse effects.

It’s worth listing some pertinent comparisons between CO2, water vapor and a criteria pollutant like SO2 (which oxidises to SO4), to see the differences:

Substance CO2 SO4/SO2 Water Vapor (H2O)
Perturbation timescale(s) > 1,000 years ~ 2 weeks ~ 10 days
Increase over background since 19th Century (%) > 50% ~350% (Greenland, 1980) ~ 4% (since 1979)
~ 9% (estimate since 1900)
Anthropogenic direct emissions ~ 36 GtCO2/yr ~ 130 MtSO2/yr (1980) ~ 21 GtH2O/yr
Anthropogenic sources Fossil fuel combustion, deforestation Sulfur in coal, biomass burning Irrigation, combustion
Attribution of anthropogenic direct sources to atmospheric increase ~ 90% 100% ~4%
Impact of climate feedbacks ~ 10% (ocean/soils etc.) 0 % ~ 96% (impact of T on saturation vapor pressure)
Adverse effects of increase Increased heat waves, sea level rise, etc. Acid rain, public health, agricultural yield More intense rainfall, enhanced global warming

The German “Summer From Hell” That Never Came…Earlier Wild Forecasts Backfire

by P. Gosselin, July 29, 2025 in NoTricksZone 


Already as early as May 2025 predictions of a hellish record-breaking hot summer with possibly thousands of heat deaths were forecast – much of it based on the unusually dry and warm spring that had gripped much of Central Europe at the time. 

Hat-tip: Frank Bosse at Klimanachrichten

The online Frankfurter Rundschau printed a weather column by meteorologist Dominick Jung just over 2 weeks ago, on July 13, warning of a “looming, huge heat dome” for the rest of the summer over Central Europe.

German TWC meteorologist Jan Schenk had already made a prediction in Focus magazine on June 10, 2025: “According to this, we can expect extreme heat and drought in Germany, especially in July and August.”

Then came reality.

Just recently, even the climate-alarmism purveyor Der Spiegel had to concede that “it feels more like autumn.”

Plenty of rain has been falling, along with snow high in the Alps.

So what was behind all the ridiculous hellish-summer forecasts? Veteran Swiss meteorologist Jörg Kachelmann in an interview with the online Bild called all the constant exaggerations and distortion: “Symbols of an education problem with us.”

At the end of June, 2025, after having made ridiculous made predictions a year earlier in 2024, biologist Mark Benecke lectured again on climate and weather to an auditorium, showing such weather model maps:

Natural Disasters in 2024 – A Quarter Century Without Change

by L. Budyn, Aug 1, 2025 in SciClimEnergie


On this specific topic of natural disasters, the managers of the database we will be using here consider it reliable from the year 2000 onward.

We are therefore approaching the 30-year period that the World Meteorological Organization (WMO) defines as the minimum required to establish “climate normals”[1], used to define and analyze climate evolution. These reference periods allow current data to be compared with past averages and to identify long-term climate trends and changes.

In this case, the diagnosis seems inescapable : if the stability — or even the decline — in the frequency of natural disasters is confirmed, then the potential link between global warming and natural disasters would become a purely academic hypothesis. Interesting from a theoretical standpoint, but lacking any observable factual basis.

Yet this stands in stark contrast to what various international agencies — and their media spokespersons — have been claiming repeatedly over the past 25 years. They have not hesitated to speak of a “doubling”[2] or even a “fivefold increase”[3] in the number of natural disasters over this period, all of which, of course, is attributed to anthropogenic global warming.

How, then, will they reconcile the stability observed in the real world with the alarmism so often relayed in the media ?

We therefore await, with some curiosity, the ad hoc explanation that will justify, in this particular case, abandoning the 30-year reference period. Climate alarmists will need to explain why this criterion — endorsed by the WMO itself — would no longer reflect long-term climate trends, as it is intended to do.