Full-time professor at the Free University of Brussels, Belgium
apreat@gmail.com
apreat@ulb.ac.be
• Department of Earth Sciences and Environment
Res. Grp. - Biogeochemistry & Modeling of the Earth System
Sedimentology & Basin Analysis
• Alumnus, Collège des Alumni, Académie Royale de Sciences, des Lettres et des Beaux Arts de Belgique (mars 2013). http://www.academieroyale.be/cgi?usr=2a8crwkksq&lg=fr&pag=858&rec=0&frm=0&par=aybabtu&id=4471&flux=8365323
• Prof. Invited, Université de Mons-Hainaut (2010-present-day)
• Prof. Coordinator and invited to the Royal Academy of Sciences of Belgium (Belgian College) (2009-
present day)
• Prof. partim to the DEA (third cycle) led by the University of Lille (9 universities from 1999 to 2004) - Prof. partim at the University of Paris-Sud/Orsay, European-Socrates Agreement (1995-1998)
• Prof. partim at the University of Louvain, Convention ULB-UCL (1993-2000)
• Since 2015 : Member of Comité éditorial de la Revue Géologie de la France http://geolfrance.brgm.fr
• Since 2014 : Regular author of texts for ‘la Revue Science et Pseudosciences’ http://www.pseudo-sciences.org/
• Many field works (several weeks to 2 months) (Meso- and Paleozoic carbonates, Paleo- to Neoproterozoic carbonates) in Europe, USA (Nevada), Papouasia (Holocene), North Africa (Algeria, Morrocco, Tunisia), West Africa (Gabon, DRC, Congo-Brazzaville, South Africa, Angola), Iraq... Recently : field works (3 to 5 weeks) Congo- Brazzaville 2012, 2015, 2016 (carbonate Neoproterozoic).
Degree in geological sciences at the Free University of Brussels (ULB) in 1974, I went to Algeria for two years teaching mining geology at the University of Constantine. Back in Belgium I worked for two years as an expert for the EEC (European Commission), first on the prospecting of Pb and Zn in carbonate environments, then the uranium exploration in Belgium. Then Assistant at ULB, Department of Geology I got the degree of Doctor of Sciences (Geology) in 1985. My thesis, devoted to the study of the Devonian carbonate sedimentology of northern France and southern Belgium, comprised a significant portion of field work whose interpretation and synthesis conducted to the establishment of model of carbonate platforms and ramps with reefal constructions.
I then worked for Petrofina SA and shared a little more than two years in Angola as Director of the Research Laboratory of this oil company. The lab included 22 people (micropaleontology, sedimentology, petrophysics). My main activity was to interpret facies reservoirs from drillings in the Cretaceous, sometimes in the Tertiary. I carried out many studies for oil companies operating in this country.
I returned to the ULB in 1988 as First Assistant and was appointed Professor in 1990. I carried out various missions for mining companies in Belgium and oil companies abroad and continued research, particularly through projects of the Scientific Research National Funds (FNRS).
My research still concerns sedimentology, geochemistry and diagenesis of carbonate rocks which leads me to travel many countries in Europe or outside Europe, North Africa, Papua New Guinea and the USA, to conduct field missions.
Since the late 90's, I expanded my field of research in addressing the problem of mass extinctions of organisms from the Upper Devonian series across Euramerica (from North America to Poland) and I also specialized in microbiological and geochemical analyses of ancient carbonate series developing a sustained collaboration with biologists of my university. We are at the origin of a paleoecological model based on the presence of iron-bacterial microfossils, which led me to travel many countries in Europe and North Africa. This model accounts for the red pigmentation of many marble and ornamental stones used in the world. This research also has implications on the emergence of Life from the earliest stages of formation of Earth, as well as in the field of exobiology or extraterrestrial life ...
More recently I invested in the study from the Precambrian series of Gabon and Congo. These works with colleagues from BRGM (Orléans) are as much about the academic side (consequences of the appearance of oxygen in the Paleoproterozoic and study of Neoproterozoic glaciations) that the potential applications in reservoir rocks and source rocks of oil (in collaboration with oil companies).
Finally I recently established a close collaboration with the Royal Institute of Natural Sciences of Belgium to study the susceptibility magnetic signal from various European Paleozoic series. All these works allowed me to gain a thorough understanding of carbonate rocks (petrology, micropaleontology, geobiology, geochemistry, sequence stratigraphy, diagenesis) as well in Precambrian (2.2 Ga and 0.6 Ga), Paleozoic (from Silurian to Carboniferous) and Mesozoic (Jurassic and Cretaceous) rocks. Recently (2010) I have established a collaboration with Iraqi Kurdistan as part of a government program to boost scientific research in this country.
My research led me to publish about 180 papers in international and national journals and presented more than 170 conference papers. I am a holder of eight courses at the ULB (5 mandatory and 3 optional), excursions and field stages, I taught at the third cycle in several French universities and led or co-managed a score of 20 Doctoral (PhD) and Post-doctoral theses and has been the promotor of more than 50 Masters theses.
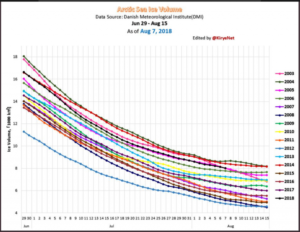
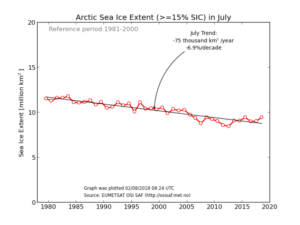
Using data from the Danish Meteorological Institute (DMI), Japanese skeptic blogger Kirye just tweeted how Arctic sea ice volume has surged to the 3rd highest level in 16 years.
…
Data source. Danish Meteorological Institute. Chart source: Kirye.
S’exprimer, sans recul, sur une canicule localisée à l’échelle du climat mondial constitue une erreur déontologique.
Il est regrettable que certains utilisent la vague de chaleur actuelle — qui au demeurant n’a rien d’anormal — afin de faire de nouveau miroiter la catastrophe climatique annoncée depuis 1992.
One of the main difficulties with tornado records is that a tornado, or evidence of a tornado must have been observed. Unlike rainfall or temperature, which may be measured by a fixed instrument, tornadoes are short-lived and very unpredictable. If a tornado occurs in a place with few or no people, it is not likely to be documented. Many significant tornadoes may not make it into the historical record since Tornado Alley was very sparsely populated during the 20th century.
Much early work on tornado climatology in the United States was done by John Park Finley in his book Tornadoes, published in 1887. While some of Finley’s safety guidelines have since been refuted as dangerous practices, the book remains a seminal work in tornado research. The University of Oklahoma created a PDF copy of the book and made it accessible at John Finley’s Tornadoes(link is external)
by P. Homewood, August 7, 2018 in NotaLotofPeopleKnowThat
Climate change: ‘Hothouse Earth’ risks even if CO2 emissions slashed
It may sound like the title of a low budget sci-fi movie, but for planetary scientists, “Hothouse Earth” is a deadly serious concept.
Researchers believe we could soon cross a threshold leading to boiling hot temperatures and towering seas in the centuries to come.
Even if countries succeed in meeting their CO2 targets, we could still lurch on to this “irreversible pathway”.
Their study shows it could happen if global temperatures rise by 2C.
…
The utterly corrupt body of climate science has been getting ever more desperate to scare people about climate change and thereby submit to their radical anti capitalist agenda.
People are not falling for it, so we are now being subjected to ever more absurd announcements like this.
Science is the enemy of global warming alarmists. And objective scientific data is that enemy on steroids. Let’s take a look at what the scientific data reveal:
During the 1930s, when the atmospheric CO2 concentration was about 100 ppm lower than today (310 ppm vs. 410 ppm), United States heat waves were just as if not more common than recent decades.
Recently there has been much ado about heat waves and the hottest-ever-recorded-temperatures making their rounds in Northern Hemisphere summer.
Yet scientists have determined that heat waves are largely driven by natural variability, not anthropogenic CO2 emissions.
Quelle aubaine pour les doctrinaires du développement durable ! Au moment de leur jour du dépassement il fait chaud, très chaud. Évidement ni l’écologisteHulot, ni France 2, ni France 24, ni la RTBF ni la ribambelle de médias impréparés ne pouvaient rater pareille occasion pour lier les deux évènements et nous culpabiliser pour introduire le contrôle de tous les détails de nos vies.
Ce premier août était donc le jour où, d’après Global Footprint Network (GFN), qui possède l’argent pour employer des dizaines de chercheurs souvent financés par les deniers publics, nous vivons désormais à crédit. À sa suite, toutes les ONG environnementales (ONGE) et nombre de politiciens se font les mégaphones de cette supercherie qui ne repose sur aucune base scientifique. Le jour du dépassement global (earth overshooting day) prétend être un indicateur dont l’objectif est de conscientiser et responsabiliser les pays développés à la notion d’empreinte écologique. Bien entendu, à part les Européens endoctrinés par les ONGE, cette théorie n’a guère d’écho dans le reste du monde.
But while Scripps is trying to tie the record-high ocean reading to the broader wave of media coverage on global heat waves, there are a few caveats to note about what the scientists found.
First, these measurements are taken from a pier that’s near the shoreline, which would not necessarily make it representative of the entire Pacific Ocean, and therefore easily influenced by local weather events.
The “anomalously warm temperatures for the past week” that Scripps researchers observed at their pier somewhat mirror the temperature pattern in 1931, and indeed, the daily records broken in the past week have been very close to readings from 87 years ago.
There is an upward trend in temperature readings from Scripps’ pier, but the trend seems to also broadly coincide with the flipping of a natural ocean cycle, the Pacific Decadal Oscillation, to its warm phase. That flip occurred around 1976.
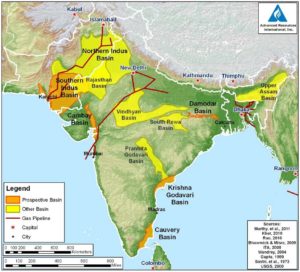
India’s cabinet approved on Wednesday a policy to allow companies to explore and exploit unconventional oil and gas resources such as shale oil and gas and coalbed methane under the existing production sharing contracts, as it aims to reduce its dependency on energy imports.
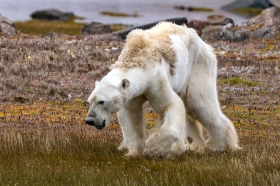
Also FoxNews: Photographer behind viral image of starving polar bear raises questions about climate change narrative
Il y a juste un an, l’image d’un ours décharné et titubant avait fait le tour du monde. Elle était supposée représenter la réalité du réchauffement de l’atmosphère. Pourtant cette hypothèse n’était pas plus probable qu’une autre, par exemple: ours vieux, malade, mourant de mort naturelle.
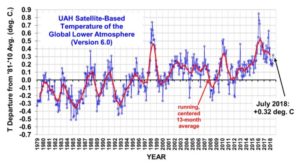
Despite all the hysterical “heat wave” and drought reports being put out to the public by the media, the Northern Hemisphere as a whole is in fact not at all that much warmer than the mean since 2000.
According to Dr. Ryan Maue, northern hemisphere temperature anomaly was zero on July 30 and the northern hemisphere land surface anomaly was actually -0.20°C.
The below is a list of past severe weather events and natural disasters – prior to the consistent 350+ppm CO2 levels attained in the 1990’s. In addition, scattered throughout the list are interesting “expert” climate predictions and observations
UM Rosenstiel School-led study exposes two threatened corals to future climate change conditions
MIAMI—New research shows that not all corals respond the same to changes in climate. The University of Miami (UM) Rosenstiel School of Marine and Atmospheric Science-led study looked at the sensitivity of two types of corals found in Florida and the Caribbean and found that one of them—mountainous star coral—possesses an adaptation that allows it to survive under high temperatures and acidity conditions.
“Stressful periods of high temperature and increasingly acidic conditions are becoming more frequent and longer lasting in Florida waters,” said Chris Langdon, marine biology and ecology professor and lead author on the new study. “However, we found that not all coral species are equally sensitive to climate change and there’s hope that some species that seemed doomed may yet develop adaptations that will allow them to survive as well.”
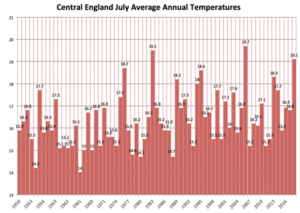
It has been for northern Europe a hot summer. Is it climate change as the media would like to have us believe? Or, is it something much simpler? For example, ocean patterns. Off the coast of Africa, water was coldest in the entire record back to 1950. A temperature change in one place of the oceans, means a change elsewhere also.
The UK July ranked 3rd warmest since 1950 in the very long term (starting 1659) temperature data-base from Central England.
Using 100-year-old minerals processing methods, chemical engineering students have found a solution to a looming 21st-century problem: how to economically recycle lithium ion batteries.
Pan, an assistant professor of chemical engineering at Michigan Technological University, earned his graduate degrees in mining engineering. It was his idea to adapt 20th century mining technology to recycle lithium ion batteries, from the small ones in cell phones to the multi-kilowatt models that power electric cars. Pan figured the same technologies used to separate metal from ore could be applied to spent batteries. So he gave his students a crash course in basic minerals processing methods and set them loose in the lab.
SPOTLIGHT: The iconic magazine is now a purveyor of propaganda.
BIG PICTURE: On her PolarBearScience.com blog last week, zoologist Susan Crockford called our attention to a startling admission over at National Geographic. It acknowledges publishing fake news. Or, as it more delicately puts it, we “went too far in drawing a definitive connection between climate change and a particular starving polar bear.”
An “Editor’s Note” explains the magazine added a wholly misleading caption to a video of an emaciated polar bear filmed last August. When it published this video on its website in December, National Geographic declared: “This is what climate change looks like.”
Actually, this is what dishonesty looks like. Neither the magazine nor the person who did the filming knew anything about that bear. It might have been stricken with disease. It might have sustained an injury that impeded its ability to hunt. As the Editor’s Note now admits: “there is no way to know for certain why this bear was on the verge of death.”
During 2017, there were 150 graphs from 122 scientific papers published in peer-reviewed journals indicating modern temperatures are not unprecedented, unusual, or hockey-stick-shaped — nor do they fall outside the range of natural variability. We are a little over halfway through 2018 and already 108 graphs from 89 scientific papers undermine claims that modern era warming is climatically unusual.
For the sake of brevity, just 13 (15%) of the 89 new papers are displayed below.
The rest of the non-hockey-stick scientific papers and graphs published thus far in 2018 can be viewed by clicking the link below.
Germany’s once highly praised solar equipment production industry has disintegrated, and now politicians are poised to make the same happen to its automobile industry.
The L. A. Times published a Ca. climate alarmist wildfire story falsely claiming that the states most recent wildfires are result of “heat like the state has never seen”.
As usual with climate fear articles like this one in the L. A. Times the scientific reality present a far different picture. The latest scientific study completed by the Royal Society concludes that global wildfires are in decline.
by P. Homewood, August 1, 2018 in NotaLotofPeopleKnowThat
There have been just seven summers over 20c since 1910:
1911
1933
1947
1976
1995
2003
2006
While we don’t know how this summer will work out (and neither does Bob Ward), since 2006 we have had eleven distinctly average summers.
The hot summers above are still rare events, and are all essentially weather events. There is no evidence that these extreme weather events are becoming more frequent.
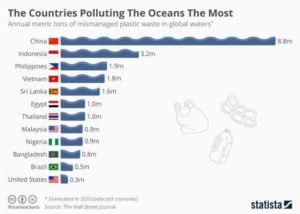
As many WUWT readers know, there’s this push to “save the planet” by banning plastic straws. Like most liberal Earth saving fantasies, it’s rooted in shonky science, or in this case, no science at all, just a guess.
This post was inspired by Anthony Watts’ recent post about wildfires and their unwillingness to cooperate with the Gorebal Warming narrative.
…
A Geological Perspective of Wildfires
The Fire Window
Geological evidence for ancient wildfires generally consists of sedimentary charcoal deposits (inertinite). Fossil charcoal is also a key factor in understanding the evolution of Earth’s atmosphere, particularly oxygen content. The first clear evidence of fire is in the Late Silurian.
…
La géologie, une science plus que passionnante … et diverse