Full-time professor at the Free University of Brussels, Belgium
apreat@gmail.com
apreat@ulb.ac.be
• Department of Earth Sciences and Environment
Res. Grp. - Biogeochemistry & Modeling of the Earth System
Sedimentology & Basin Analysis
• Alumnus, Collège des Alumni, Académie Royale de Sciences, des Lettres et des Beaux Arts de Belgique (mars 2013). http://www.academieroyale.be/cgi?usr=2a8crwkksq&lg=fr&pag=858&rec=0&frm=0&par=aybabtu&id=4471&flux=8365323
• Prof. Invited, Université de Mons-Hainaut (2010-present-day)
• Prof. Coordinator and invited to the Royal Academy of Sciences of Belgium (Belgian College) (2009-
present day)
• Prof. partim to the DEA (third cycle) led by the University of Lille (9 universities from 1999 to 2004) - Prof. partim at the University of Paris-Sud/Orsay, European-Socrates Agreement (1995-1998)
• Prof. partim at the University of Louvain, Convention ULB-UCL (1993-2000)
• Since 2015 : Member of Comité éditorial de la Revue Géologie de la France http://geolfrance.brgm.fr
• Since 2014 : Regular author of texts for ‘la Revue Science et Pseudosciences’ http://www.pseudo-sciences.org/
• Many field works (several weeks to 2 months) (Meso- and Paleozoic carbonates, Paleo- to Neoproterozoic carbonates) in Europe, USA (Nevada), Papouasia (Holocene), North Africa (Algeria, Morrocco, Tunisia), West Africa (Gabon, DRC, Congo-Brazzaville, South Africa, Angola), Iraq... Recently : field works (3 to 5 weeks) Congo- Brazzaville 2012, 2015, 2016 (carbonate Neoproterozoic).
Degree in geological sciences at the Free University of Brussels (ULB) in 1974, I went to Algeria for two years teaching mining geology at the University of Constantine. Back in Belgium I worked for two years as an expert for the EEC (European Commission), first on the prospecting of Pb and Zn in carbonate environments, then the uranium exploration in Belgium. Then Assistant at ULB, Department of Geology I got the degree of Doctor of Sciences (Geology) in 1985. My thesis, devoted to the study of the Devonian carbonate sedimentology of northern France and southern Belgium, comprised a significant portion of field work whose interpretation and synthesis conducted to the establishment of model of carbonate platforms and ramps with reefal constructions.
I then worked for Petrofina SA and shared a little more than two years in Angola as Director of the Research Laboratory of this oil company. The lab included 22 people (micropaleontology, sedimentology, petrophysics). My main activity was to interpret facies reservoirs from drillings in the Cretaceous, sometimes in the Tertiary. I carried out many studies for oil companies operating in this country.
I returned to the ULB in 1988 as First Assistant and was appointed Professor in 1990. I carried out various missions for mining companies in Belgium and oil companies abroad and continued research, particularly through projects of the Scientific Research National Funds (FNRS).
My research still concerns sedimentology, geochemistry and diagenesis of carbonate rocks which leads me to travel many countries in Europe or outside Europe, North Africa, Papua New Guinea and the USA, to conduct field missions.
Since the late 90's, I expanded my field of research in addressing the problem of mass extinctions of organisms from the Upper Devonian series across Euramerica (from North America to Poland) and I also specialized in microbiological and geochemical analyses of ancient carbonate series developing a sustained collaboration with biologists of my university. We are at the origin of a paleoecological model based on the presence of iron-bacterial microfossils, which led me to travel many countries in Europe and North Africa. This model accounts for the red pigmentation of many marble and ornamental stones used in the world. This research also has implications on the emergence of Life from the earliest stages of formation of Earth, as well as in the field of exobiology or extraterrestrial life ...
More recently I invested in the study from the Precambrian series of Gabon and Congo. These works with colleagues from BRGM (Orléans) are as much about the academic side (consequences of the appearance of oxygen in the Paleoproterozoic and study of Neoproterozoic glaciations) that the potential applications in reservoir rocks and source rocks of oil (in collaboration with oil companies).
Finally I recently established a close collaboration with the Royal Institute of Natural Sciences of Belgium to study the susceptibility magnetic signal from various European Paleozoic series. All these works allowed me to gain a thorough understanding of carbonate rocks (petrology, micropaleontology, geobiology, geochemistry, sequence stratigraphy, diagenesis) as well in Precambrian (2.2 Ga and 0.6 Ga), Paleozoic (from Silurian to Carboniferous) and Mesozoic (Jurassic and Cretaceous) rocks. Recently (2010) I have established a collaboration with Iraqi Kurdistan as part of a government program to boost scientific research in this country.
My research led me to publish about 180 papers in international and national journals and presented more than 170 conference papers. I am a holder of eight courses at the ULB (5 mandatory and 3 optional), excursions and field stages, I taught at the third cycle in several French universities and led or co-managed a score of 20 Doctoral (PhD) and Post-doctoral theses and has been the promotor of more than 50 Masters theses.
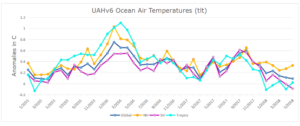
Presently sea surface temperatures (SST) are the best available indicator of heat content gained or lost from earth’s climate system. Enthalpy is the thermodynamic term for total heat content in a system, and humidity differences in air parcels affect enthalpy. Measuring water temperature directly avoids distorted impressions from air measurements. In addition, ocean covers 71% of the planet surface and thus dominates surface temperature estimates. Eventually we will likely have reliable means of recording water temperatures at depth.
Recently, Dr. Ole Humlum reported from his research that air temperatures lag 2-3 months behind changes in SST. He also observed that changes in CO2 atmospheric concentrations lag behind SST by 11-12 months. This latter point is addressed in a previous post Who to Blame for Rising CO2?
The May update to HadSST3 will appear later this month, but in the meantime we can look at lower troposphere temperatures (TLT) from UAHv6 which are already posted for May. The temperature record is derived from microwave sounding units (MSU) on board satellites like the one pictured above… (…)
Voici quelques réflexions sur la théorie de l’acidification des océans. Selon cette théorie, le pH des océans diminuerait inlassablement, en raison du CO2 qui ne cesse de s’accumuler dans l’atmosphère.
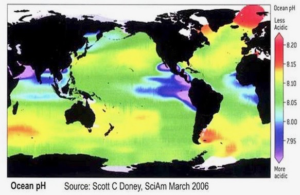
• Les mesures directes de pH sont récentes et nous n’avons aucun recul. Selon les médias et les ONG écologistes, qui se basent sur le GIEC et sur certaines publications (e.g., Caldeira & Wickett 2003), le pH des océans aurait été de 8.25 en 1750. Cependant, il faut savoir que personne n’a jamais mesuré le pH des océans en 1750, puisque le concept de pH n’a été inventé qu’en 1909 (par le danois Søren P.L. Sørensen), et que les premiers appareils fiables pour mesurer le pH ne sont apparus qu’en 1924… Nous ne sommes donc pas certains de cette valeur de 8.25 pour 1750… La valeur de 8.25 est donc obtenue par des mesures indirectes et n’est donc pas certaine.
• A l’heure d’aujourd’hui, tous les pH sont possibles. Lorsqu’on dit que les océans actuels sont à un pH de 8.1, de quel océan parle-t-on? S’agit-il du pH moyen global? Si c’est de cela qu’on parle, quelle est l’incertitude sur la mesure? (i.e., l’écart-type?). Ceci n’est jamais indiqué. Il faut savoir que si l’on prend un jour de la semaine, tous les pH sont possibles dans les océans, comme l’illustre très bien la figure suivante.
When if comes to debunking Gorebal Warming, Chicken Little of the Sea (“ocean acidification”) and other Warmunist myths, my favorite starting points are my old college textbooks.
Way back in the Pleistocene (spring semester 1979) in Marine Science I, our professor, Robert Radulski, assigned us The Oceans by Sverdrup (yes, that Sverdrup), Johnson and Fleming. Even though it was published in 1942, it was (and may still be) considered the definitive oceanography textbook. I looked up “ocean acidification” in the index… It wasn’t there.
The notion that CO2 partial pressure influences the pH of seawater isn’t a new concept, *surely* ocean acidification must have been mentioned in at least one of my college textbooks.
by Tony Heller, June 4, 2018 in TheDeplorableClimSciBlog
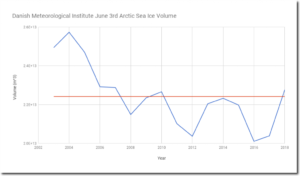
According to the Danish Meteorological Institute, Arctic sea ice volume is highest for the past eleven years and above the fifteen year mean since the start of DMI records in 2003.
Dr. Boris M. Smirnov, a prominent atomic physicist, has authored 20 physics textbooks during the last two decades. His latest scientific paper suggests that the traditional “absorption band” model for calculating the effect of atmospheric CO2 during the radiative transfer process is flawed. New calculations reveal that the climate’s sensitivity to a doubling of the CO2 concentration is just 0.4 K, and the human contribution to that value is a negligible 0.02 K.
A small asteroid hit Earth on Saturday, June 2nd, exploding in the atmosphere over Botswana before it could reach the ground. The Catalina Sky Survey in Arizona had discovered the space rock only hours earlier as it hurtled toward our planet from inside the orbit of the Moon. Sensors used to monitor rogue nuclear explosions detected the asteroid and estimated its yield near ~500 tons of TNT.
SPOTLIGHT: Whether the predictions in Paul Ehrlich’s 50-year-old bestseller, The Population Bomb, were right or wrong matters. Because scientists and environmentalists continue to follow in his footsteps.
BIG PICTURE: Ehrlich is an important case study. His conviction that humanity is a blight on the planet is shared by many ordinary people, as well as by many influential ones (…)
by Wallace Manheimer, June 4, 2018 in ClimateChangeDispatch
A claimed nearly unanimous scientific consensus on fear of climate change has caused a push to substantially reduce or even eliminate the use of fossil fuel in favor of solar and wind.
But three crucial questions are: 1) is the scientific community really united? 2) can solar and wind take over any time soon to provide the required vital energy for the maintenance of modern civilization in today’s world of 7 billion people?, and 3) has CO2 caused any harm yet? The answer to all three questions is no.
A major theme of this essay is that many assertions can easily be checked out by a simple Google search.
After finally realizing that the claimed rising temperatures never showed up around the globe, the scientific community is being told through its most respected publications that specific forms of pollution that are human-generated are keeping populations from experiencing the toll of other airborne human-made emissions.
“Pollution in the atmosphere is having an unexpected consequence, scientists say – it’s helping to cool the climate, masking some of the global warming that’s occurred so far,” Scientific American reported last week. “That means efforts worldwide to clean up the air may cause an increase in warming, as well as other climate effects, as this pollution disappears.”
Germany’s task force for phasing out coal was meant to launch this week, but yesterday the government quietly announced it is delaying the kick-off. It is the third time the coal exit commission’s launch has been delayed.
The task force has become so controversial – even before it comes into existence – that the government can’t get it started. Since the idea was proposed by German Chancellor Angela Merkel last year, it has been plagued by fighting over who will lead it, what it will do, and how much power it will have.
by Iceagenow, May 24, 2018 in Principia.Sci.International
Killed more than 500,000 people.
Andrew McKillop has a new article posted at The Market Oracle. Here are some excerpts.
This is the global cooling fear
Intense flooding in the low countries of Europe became “darkly repetitive” during the Little Ice Age, writes McKillop. The cooling period lasted 450 years,
That’s more than a 25% adjustment (15,000 sq. km to 19,000 sq km). So while chunks the size of Manhattans may break off from time to time, about 300 Manhattans of new ice gets added annually.
The report notes that in the Antarctic Ocean: “the annual maximum and annual mean sea ice extents have shown a long-term trend of increase since 1979”.
Le Précambrien représente 88% de l’histoire de la Terre âgée de 4,567 milliards d’années (Ga).
C’est au cours de cette période peu connue, peu enseignée que se sont déroulés ou mis en place des événements physico-chimiques et biologiques déterminants: différenciation des enveloppes terrestres, tectonique des plaques et premières ‘pangées’ ou supercontinents, champ magnétique, chaînes de montagnes, glaciations, anoxies des bassins, remplacement du CO2-CH4par l’oxygène atmosphérique, formation de gisements (uranium, manganèse, nickel …. et même pétrole), émergence dès 3,8 Ga des procaryotes puis des eucaryotes …
Vu l’absence de fossiles stratigraphiques, et donc de biozones, la stratigraphie du Précambrien est encore très difficile, elle est intialement basée sur la lithostratigraphie. De grands progrès ont récemment été réalisés grâce à la chimiostratigraphie istotopique (C, O, Sr….) en plus de la radiométrie absolue.
L’exposé se consacrera aux événements sédimentaires liés au Grand Evénement de l’Oxygène il y a environ 2,5-2,1 Ga (Paléoprotérozoïque) et à ceux liés à la ‘Terre Boule de Neige’ (Snowball Earth) avec la glaciation marinoenne il y a 0,635 Ga (Néoprotérozoïque), à partir des séries de l’Afrique de l’Ouest.
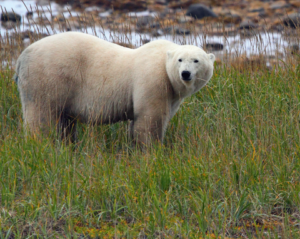
DDuring a meeting of polar bear range states (Canada, Russia, Greenland, Norway, and the USA) in late January 2018 to discuss conservation issues, Canada — home to ~2/3 of the world’s polar bears — included in its presentation an updated population status and trend map approved by the Polar Bear Technical Committee in its presentation. This 2017 map replaces one from 2014 but is not yet available on the Environment Canada website.
Because trees may only grow within narrowly-defined temperature ranges and elevations above sea level, perhaps the most reliable means of assessing the air temperatures of past climates is to collect ancient treeline evidence. In a new paper, Kullman (2018) found tree remnants at mountain sites 600 to 700 meters north of where the modern treeline ends, strongly implying Early Holocene air temperatures in northern Sweden were 3-4°C warmer than recent decades.
Since the 1950s the number of lives and the amount of money lost to floods have declined, despite little change to the frequency of catastrophic floods, according to the first comprehensive study of European historical records.
Academics at Delft University of Technology in the Netherlands found that the number of flood deaths across Europe has been falling by about 5 per cent a year for the past six decades. Financial losses to flooding have declined by 2 per cent a year, according to their paper in Nature Communications.
There is a continuing debate over sea level rise, especially how much will occur in the future. The most annoying part of the news media reporting on the issue is that they imply sea level rise is all the fault of humans.
This is why the acceleration of sea level rise is what is usually debated, because sea level has been rising naturally, for at least 100 years before humans could be blamed. So, the two questions really are (1) Has sea level rise accelerated?, and (2) how much of the acceleration is due to humans?
Yesterday’s spat between Gavin Schmidt and Willis Eschenbach dealt with the question of whether sea level rise has accelerated or not. Gavin says it has. Willis says not, or at least not by a statistically significant amount. (…)
by Paul Homewood, May 30, 2018 in NotaLotofPeopleknowThat
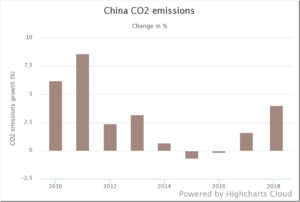
China’s carbon emissions growth has accelerated since the beginning of the year, leading to warnings that the country could be headed for its largest annual increase in climate pollution since 2011.
Led by increased demand for coal, oil and gas, China’s CO2 emissions for the first three months of 2018 were 4% higher than they were for the same period in 2017, according to an Unearthed analysis of new government figures.
Analysts have suggested the country’s carbon emissions could rise this year by 5% — the largest annual increase in seven years, back when the airpocalypse was at its peak (…)
Corals around Japan are fleeing northwards, according to a new study. One type has been spotted ‘sprinting’ at 14 kilometres a year, thanks to a lift from ocean currents. That means ocean ecosystems could shift rapidly in the face of climate-change impacts such as warming seas, the authors say.
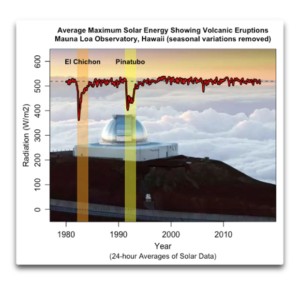
Inspired by Richard Keen’s interesting WUWT post on using eclipses to determine the clarity of the atmosphere, I went to the website of the Hawaiian Mauna Loa Observatory. They have some very fascinating datasets. One of them is a measurement of direct solar radiation, minute by minute, since about 1980.
I thought that I could use that dataset to determine the clarity of the atmosphere by looking at the maximum downwelling solar energy on a month by month basis. I’ve described my method of extracting the maximum solar energy from the minute by minute data in the appendix for those interested.
Most estimates of Chinese regional Surface Air Temperatures since the late-19th century have identified two relatively warm periods – 1920s–40s and 1990s–present. However, there is considerable debate over how the two periods compare to each other. Some argue the current warm period is much warmer than the earlier warm period. Others argue the earlier warm period was comparable to the present. In this collaborative paper, including authors from both camps, the reasons for this ongoing debate are discussed. Several different estimates of Chinese temperature trends, both new and previously published, are considered. A study of the effects of urbanization bias on Chinese temperature trends was carried out using the new updated version of the Global Historical Climatology Network (GHCN) – version 4 (currently in beta production)
Over millennia, the reef has adapted to sudden changes in environment by migrating across the sea floor as the oceans rose and fell.
The study published today in Nature Geoscience, led by University of Sydney’s Associate Professor Jody Webster, is the first of its kind to reconstruct the evolution of the reef over the past 30 millennia in response to major, abrupt environmental change.
The 10-year, multinational effort has shown the reef is more resilient to major environmental changes such as sea-level rise and sea-temperature change than previously thought but also showed a high sensitivity to increased sediment input and poor water quality. (…)
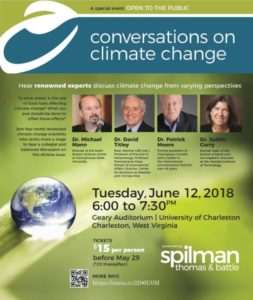
This manntastic event looms large. With the irascible Dr. Mann pitted against Moore and Curry, fireworks are almost guaranteed. Titley is a lightweight and he’ll be overshadowed by Mann’s huge ego and need to control the conversation. Their idea to hear a “collegial and balanced” discussion may very well be a pipe dream, especially after what happened the last time when Mann and Curry were testifying before congress.
BIG PICTURE: The Population Bomb was first published in May 1968 – 50 years ago this month. Page one of my copy, printed in 1970, describes its author as “a qualified scientist.” The back cover provides further detail: (…)
A landmark paper by warmist scientists in Nature Geosciencenow concedes the world has indeed not warmed as predicted, thanks to a slowdown in the first 15 years of this century. One of its authors, Michael Grubb, professor of international energy and climate change at University College London, admits his past predictions of runaway warming were too alarmist.
“When the facts change, I change my mind. We are in a better place than I thought.”
ANOTHER author, Myles Allen, professor of geosystem science at Oxford, confessed that too many of the mathematical models used by climate scientists to predict future warming “were on the hot side” — meaning they exaggerated.
“We haven’t seen that rapid acceleration in warming after 2000 that we see in the models.”
(…)
La géologie, une science plus que passionnante … et diverse