Full-time professor at the Free University of Brussels, Belgium
apreat@gmail.com
apreat@ulb.ac.be
• Department of Earth Sciences and Environment
Res. Grp. - Biogeochemistry & Modeling of the Earth System
Sedimentology & Basin Analysis
• Alumnus, Collège des Alumni, Académie Royale de Sciences, des Lettres et des Beaux Arts de Belgique (mars 2013). http://www.academieroyale.be/cgi?usr=2a8crwkksq&lg=fr&pag=858&rec=0&frm=0&par=aybabtu&id=4471&flux=8365323
• Prof. Invited, Université de Mons-Hainaut (2010-present-day)
• Prof. Coordinator and invited to the Royal Academy of Sciences of Belgium (Belgian College) (2009-
present day)
• Prof. partim to the DEA (third cycle) led by the University of Lille (9 universities from 1999 to 2004) - Prof. partim at the University of Paris-Sud/Orsay, European-Socrates Agreement (1995-1998)
• Prof. partim at the University of Louvain, Convention ULB-UCL (1993-2000)
• Since 2015 : Member of Comité éditorial de la Revue Géologie de la France http://geolfrance.brgm.fr
• Since 2014 : Regular author of texts for ‘la Revue Science et Pseudosciences’ http://www.pseudo-sciences.org/
• Many field works (several weeks to 2 months) (Meso- and Paleozoic carbonates, Paleo- to Neoproterozoic carbonates) in Europe, USA (Nevada), Papouasia (Holocene), North Africa (Algeria, Morrocco, Tunisia), West Africa (Gabon, DRC, Congo-Brazzaville, South Africa, Angola), Iraq... Recently : field works (3 to 5 weeks) Congo- Brazzaville 2012, 2015, 2016 (carbonate Neoproterozoic).
Degree in geological sciences at the Free University of Brussels (ULB) in 1974, I went to Algeria for two years teaching mining geology at the University of Constantine. Back in Belgium I worked for two years as an expert for the EEC (European Commission), first on the prospecting of Pb and Zn in carbonate environments, then the uranium exploration in Belgium. Then Assistant at ULB, Department of Geology I got the degree of Doctor of Sciences (Geology) in 1985. My thesis, devoted to the study of the Devonian carbonate sedimentology of northern France and southern Belgium, comprised a significant portion of field work whose interpretation and synthesis conducted to the establishment of model of carbonate platforms and ramps with reefal constructions.
I then worked for Petrofina SA and shared a little more than two years in Angola as Director of the Research Laboratory of this oil company. The lab included 22 people (micropaleontology, sedimentology, petrophysics). My main activity was to interpret facies reservoirs from drillings in the Cretaceous, sometimes in the Tertiary. I carried out many studies for oil companies operating in this country.
I returned to the ULB in 1988 as First Assistant and was appointed Professor in 1990. I carried out various missions for mining companies in Belgium and oil companies abroad and continued research, particularly through projects of the Scientific Research National Funds (FNRS).
My research still concerns sedimentology, geochemistry and diagenesis of carbonate rocks which leads me to travel many countries in Europe or outside Europe, North Africa, Papua New Guinea and the USA, to conduct field missions.
Since the late 90's, I expanded my field of research in addressing the problem of mass extinctions of organisms from the Upper Devonian series across Euramerica (from North America to Poland) and I also specialized in microbiological and geochemical analyses of ancient carbonate series developing a sustained collaboration with biologists of my university. We are at the origin of a paleoecological model based on the presence of iron-bacterial microfossils, which led me to travel many countries in Europe and North Africa. This model accounts for the red pigmentation of many marble and ornamental stones used in the world. This research also has implications on the emergence of Life from the earliest stages of formation of Earth, as well as in the field of exobiology or extraterrestrial life ...
More recently I invested in the study from the Precambrian series of Gabon and Congo. These works with colleagues from BRGM (Orléans) are as much about the academic side (consequences of the appearance of oxygen in the Paleoproterozoic and study of Neoproterozoic glaciations) that the potential applications in reservoir rocks and source rocks of oil (in collaboration with oil companies).
Finally I recently established a close collaboration with the Royal Institute of Natural Sciences of Belgium to study the susceptibility magnetic signal from various European Paleozoic series. All these works allowed me to gain a thorough understanding of carbonate rocks (petrology, micropaleontology, geobiology, geochemistry, sequence stratigraphy, diagenesis) as well in Precambrian (2.2 Ga and 0.6 Ga), Paleozoic (from Silurian to Carboniferous) and Mesozoic (Jurassic and Cretaceous) rocks. Recently (2010) I have established a collaboration with Iraqi Kurdistan as part of a government program to boost scientific research in this country.
My research led me to publish about 180 papers in international and national journals and presented more than 170 conference papers. I am a holder of eight courses at the ULB (5 mandatory and 3 optional), excursions and field stages, I taught at the third cycle in several French universities and led or co-managed a score of 20 Doctoral (PhD) and Post-doctoral theses and has been the promotor of more than 50 Masters theses.
The well has been drilled through the Lower Bowland shale at a depth of approximately 2,700m (8,860 ft) below ground and extends laterally 800m (2,620 ft).
Francis Egan, chief executive officer of Cuadrilla, said the government’s recent announcement underlined the “national importance of shale gas”.
“We are now very close to demonstrating that Lancashire shale gas can be commercially developed in a safe and environmentally responsible manner.”
The firm said drilling on a second horizontal shale gas exploration well at the site is due to be complete soon when it will lodge a second fracking application.
It said it expects to start fracking both wells later this year.
In Figure 29 of that paper, Hansen claims to show that sea level rise has been accelerating, from 0.6 mm/year from 1900 to 1930, to 1.4 mm/year from 1930 to 1992, and 2.6 mm/year from 1993 to 2015.
When marine algae die, they usually float in slow motion to the ocean’s depths. However, during an expedition with the research icebreaker Polarstern to the Arctic in the spring of 2015, scientists from the Alfred Wegener Institute, Helmholtz Centre for Polar and Marine Research (AWI) discovered a phenomenon that significantly accelerate this transport: tiny gypsum crystals, which form during the freezing of salt in the porous spaces of Arctic sea ice, weigh down the phytoplankton like heavy ballast, pulling them to the bottom within a matter of hours. The effect is like an express elevator for the carbon they contain. “This mechanism was previously completely unknown,” says marine bio-geologist Dr Jutta Wollenburg … (…)
by Li M. et al., 2017 in CO2Science/Int.J.Biometeorology
In discussing the characteristics of their three-century temperature proxy, the authors report the existence of two prominent decadal-scale cold periods (1801-1833 and 1961-2003) and two prominent decadal-scale warm periods (1730-1800 and 1928-1960). They also note that “fifteen extreme cold years (< -1.5σ) were identified and most occurred within 1-2 years after major volcanic eruptions,” contrasting with the finding that the two decadal-scale warm periods both occurred during “gaps in volcanic activities.”
Perhaps the most significant observation made by the authors, however, is that “none of the extreme warm years [< 1.5σ] or decades occurred in the most recent 30 years,” which fact runs counter to anthropogenic global warming claims that temperatures of the past few decades have been the warmest of the past thousand years (…)
Iran’s deputy environment chief Karim Shafie has warned that Iran’s participation in the Paris Agreement is at risk if they don’t get their climate money.
by Tony Heller, May 22, 2018 in TheDeplorableClimateScienceBlog
Settled science at NASA means constantly rewriting the past. Here are a few of the NASA Reykjavik, Iceland temperature graphs I have captured over the past six years.
by Andrea Ayemoba, May 21, 2018 in AfricaBusinessCommunities
Shell Nigeria Gas (SNG) Limited has increased its domestic gas distribution capacity by 150% over the last six months. The increase in capacity will enable the company to distribute more than 100 million standard cubic feet of gas per day (MMscf/d) to businesses in its western operations.
There is a strong possibility that Poland will build a floating Liquefied Natural Gas (LNG) terminal in Gdańsk, according to Fred H. Hutchison, who says “a lot of gas” can come to Central European markets this way.
Fred H. Hutchison is president and CEO of LNG Allies, an industry association working to expedite and maximise US exports of liquefied natural gas (LNG). In Bratislava, Hutchinson gave a speech at the Energy Committee of the American Chamber of Commerce.
Imports of natural gas from Russia have increased over the years and represented 34% of EU’s supply in 2016 according to ACER. Given the cheap price of Russian gas, do you see a window of opportunity for Amercian LNG on the European market?
Al Gore wrote in the Huffington Post (August 28, 2014) that the need for “bold action” to curtail “old dirty sources of energy … is obvious and urgent.” The proper scientific response to an assertion like that is why? How can I test this idea? Science is not a belief, it is a method of testing ideas. We use an idea to make predictions and then we gather data to see if the predictions are correct. If the predictions are accurate, the idea survives. If any of the predictions fail, the idea is disproven, and it must be modified or simply rejected.
The experiments conducted by Lawrence Livermore National Laboratory researcher Kayla Kroll and her colleagues were prompted by a recent spike in induced earthquake activity related to oil and gas production in the U.S. and Canada. The rise in induced earthquakes has some scientists proposing changes in injection or production processes to reduce the fluid pressures that destabilize faults in these regions.
In their simulations, Kroll and colleagues “found that active management was most advantageous for wells that were closest to a fault. This scenario is most successful at reducing the total number of seismic events and also the maximum magnitude of those events,” Kroll said. In their simulations, a “close well” was one to four meters away from a fault (…)
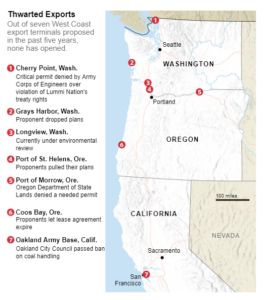
U.S. coal production declined from 2011 through 2016 as it was displaced in U.S. power plants by cheaper and cleaner natural gas. Some of the reduction was also due to the Obama Clean Power Plan regulations. However, the shale gas revolution in the U.S. has not spread to other countries, perhaps due to the “fracking” scare, so worldwide use of coal increased rapidly until 2013. From 2000 until 2013 global coal use increased at a rate of over 4% per year. This led to an increase in U.S. coal exports (see Figure 1) because the U.S. is a low-cost producer of high quality coal. Coal consumption worldwide has flattened and is expected to stay flat through 2040, according to ExxonMobil’s 2018 Energy Outlook as well as the EIA. Currently coal provides 25% of the global energy supply and this is projected to decrease to 20% by 2040 according to ExxonMobil.
Figure 2. U.S. coal export terminal construction locations blocked by environmentalist lobbying. Source: The Wall Street Journal.
by S. Xu et al., December 2017, in AGU1000Biogeosciences
Coral bleaching is becoming a serious issue for coral reefs under the stress of global warming. However, whether it has occurred in the past in times of thermal stress remains unclear. Moreover, an understanding of historic coral bleaching events would greatly improve our insight into the adaptive capabilities of corals under such stresses. It is known that Porites corals, a massive coral, have relatively high levels of symbiotic zooxanthellae and a strong thermal tolerance when compared with most other corals (and particularly branched corals). Thus, growth hiatuses and/or mortality surfaces of fossil Porites may be used to indicate past ecological or environmental stress events, such as severe bleaching. In this study, monthly geochemical and isotopic environmental proxies of four fossil Porites corals with well‐preserved growth hiatuses and mortality surfaces (aged 3,800–4,200 years before 2013 A.D.), collected from Wenchang fringing reef, Hainan Island, Northern South China Sea were analyzed. Specifically, the Sr/Ca, δ18O, and δ13C were measured with a monthly resolution for each sample.
Thanks to GWPF for publishing posthumously Bill Gray’s understanding of global warming/climate change. The paper was compiled at his request, completed and now available as Flaws in applying greenhouse warming to Climate Variability This post provides some excerpts in italics with my bolds and some headers. Readers will learn much from the entire document (title above is link to pdf).
The Fundamental Correction
The critical argument that is made by many in the global climate modeling (GCM) community is that an increase in CO2 warming leads to an increase in atmospheric water vapor, resulting in more warming from the absorption of outgoing infrared radiation (IR) by the water vapor (…)
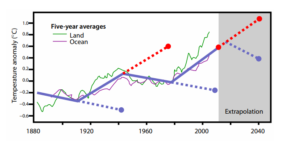
Figure 14: Global surface temperature change since 1880. The dotted blue and dotted red lines illustrate how much error one would have made by extrapolating a multi-decadal cooling or warming trend beyond a typical 25-35 year period. Note the recent 1975-2000 warming trend has not continued, and the global temperature remained relatively constant until 2014.
The effects of past land-cover changes on climate are disputed. Previous modelling studies have generally concluded that the biogeophysical effects of historical deforestation led to an annual mean cooling in the northern mid-latitudes, in line with the albedo-induced negative radiative forcing from land-cover changes since pre-industrial time reported in the most recent Intergovernmental Panel on Climate Change report. However, further observational and modelling studies have highlighted strong seasonal and diurnal contrasts in the temperature response to deforestation
I should know. I’m a former climate research scientist at Environment Canada. And I was an expert reviewer for the United Nations’ International Panel on Climate Change (IPCC) and its 2007 Climate Change Report.
The wintry weather held its grip over most of Canada well into April, from Vancouver to St. John’s, as snow, freezing rain, ice pellets and ferocious winds hammered everyone. A few noteworthy wintry tales:
Calgary is set for record snowfall.
Edmonton set a record for continuous days of below-freezing temperatures this winter.
Most of the Canadian Prairies were still in winter-like weather mode in mid-April.
Toronto has recorded one of the highest numbers of Heating Degree Days at 3,485 and counting.
Atlantic Canada braced for more wintry weather with snow accumulation of 10 to 25 cm in mid-month.
This year’s winter could be the longest, snowiest and coldest in 40 years.
By investigating fossils, Prof. Kießling and Dr. Carl Reddin, who is also at GeoZentrum Nordbayern, have shown that coral, molluscs, and sponges have been following their preferred cold and warm zones for half a billion years. Isotherms (geographic lines denoting the same temperature, for example 20°C) shift towards the poles or the equator as soon as the global temperature rises or decreases. Isotherms have been shifting towards the poles for several years due to global warming.
The tendency towards climate-related migration is most apparent in tropical species. This may be due to the fact that several of these species live near the thermal maximum for complex organisms of 35-45°C . Current global warming trends are driving marine animals towards the poles, provided there is a suitable habitat they can migrate to.
Clues from some unusual Arizona rocks pointed Rice University scientists toward a discovery — a subtle chemical signature in rocks the world over — that could answer a long-standing mystery: What stole the iron from Earth’s continents?
The find has weighty implications. If the iron content of continental rocks was a bit greater, as it is in the rocks beneath Earth’s oceans, for example, our atmosphere might look more like that of Mars, a planet so littered with rusty, oxidized rocks that it appears red even from Earth.
In a new paper available online in Science Advances, Rice petrologists Cin-Ty Lee, Ming Tang, Monica Erdman and Graham Eldridge make a case that garnet steals the most iron from continents. The hypothesis flies in the face of 40-plus years of geophysical thinking, and Tang, a postdoctoral fellow, and Lee, professor and chair of the Department of Earth, Environmental and Planetary Sciences at Rice, said they expect a healthy dose of skepticism from peers.
The researchers claim adding historical data derived fudge factors to correct the discrepancy between climate models and historical observations, producing a Frankenmodel mix of fudge factors and defective physics, will make climate predictions more reliable (…)
by M. Shellenberger, President, Env. Progr., May 16, 2018 in WUWT
Over the last year, the media have published story after story after story about the declining price of solar panels and wind turbines.
People who read these stories are understandably left with the impression that the more solar and wind energy we produce, the lower electricity prices will become.
And yet that’s not what’s happening. In fact, it’s the opposite.
by Fred Singer, May 15, 2018 in TheWallStreetJournal
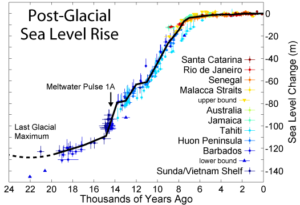
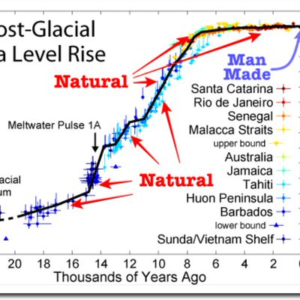
It is generally thought that sea-level rise accelerates mainly by thermal expansion of sea water, the so-called steric component. But by studying a very short time interval, it is possible to sidestep most of the complications, like “isostatic adjustment” of the shoreline (as continents rise after the overlying ice has melted) and “subsidence” of the shoreline (as ground water and minerals are extracted).
I chose to assess the sea-level trend from 1915-45, when a genuine, independently confirmed warming of approximately 0.5 degree Celsius occurred. I note particularly that sea-level rise is not affected by the warming; it continues at the same rate, 1.8 millimeters a year, according to a 1990 review by Andrew S. Trupin and John Wahr. I therefore conclude—contrary to the general wisdom—that the temperature of sea water has no direct effect on sea-level rise. That means neither does the atmospheric content of carbon dioxide.
NASA says the greening of the planet is due to increased CO2, these guys are arguing against that, saying increased forest growth “correlates strongly to the UN Development Programme’s Human Development Index”. Riiiighht. They say that “Europe’s early turnaround and expansion of forest resources obviously can’t be attributed to the rapid rise of atmospheric carbon dioxide that began decades later”. By the same token, the U.N. didn’t exist until decades later, and they sure as hell haven’t had any impact on the greening of the Eastern United States as shown in their map below (…)
La géologie, une science plus que passionnante … et diverse
