We know that prediction is difficult, especially about the future as the saying goes, but as an entertainment in the festive season we are asking for your 2018 global temperature forecast.
Every year at this time the UK Met Office issues its forecast of the global annual temperature for the following year. This time it says that 2018 will be another very warm year globally, but it is unlikely to be a new record due to the cooling effect of about 0.1 °C from a moderate La Niña in the Pacific.
by RomanM, December 28, 2017 in McIntyre ClimAudit
The “lipstick” on the paper’s Figure 2 is perhaps one of the best examples of creating a misleading aura of “real science” that I have encountered in some time (…)
by Fred Pearce, December 19, 2017 in Yale Environment360
In September, some 200 scientists wrote to the EU insisting that “bioenergy [from forest biomass] is not carbon-neutral” and calling for tighter rules to protect forests and their carbon. Yet just a month later, EU ministers rubber-stamped the existing carbon accounting rules, reaffirming that the burning of wood pellets is renewable energy.
At the German Die kalte Sonne site here, Dr. Sebastian Lüning and Prof. Fritz Vahrenholt present another two recent papers showing that models are failing to simulate the climate and cannot be used to make prognoses.
Reflecting upon my previous post, Where The Temperature Rules The Sun, I realized that while it was valid, it was just about temperature controlling downwelling solar energy via cloud variations. However, it didn’t cover total energy input to the surface. The total energy absorbed by the surface is the sum of the net solar energy (surface downwelling solar minus surface reflections) plus the downwelling longwave infrared, or DWIR. This is the total energy that is absorbed by and actually heats the surface.
For the first time scientists have directly observed living bacteria in polar ice and snow — an environment once considered sterile. “As microbial activity and its influence on its local environment has never been taken into account when looking at ice-core gas samples it could provide a moderate source of error in climate history interpretations.”
There have been so many very good essays on Global Sea Level Rise by persons all of whom have a great deal more expertise than I. Jo Nova hosts a dozen or so excellent essays, which point at another score of papers and publications, for the most part clearly demonstrating that there are two contrarian positions on sea level rise in the scientific community: 1) Sea level has risen, is rising and will continue to rise at a rate approximately 8-12 inches (20-30 centimeters) per century — due to geological and long-term climatic forces well beyond our control; and 2a) Other than explicit cases of Local Relative SLR, the sea does not appear to be rising much over the last 50-70 years, if at all. 2b) If it is rising due to general warming of the climate it will not add much to position 1.
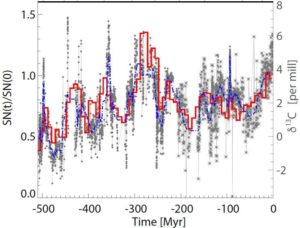
(…)In conclusion, a mechanism by which ions condense their mass onto small aerosols and thereby increase the growth rate of the aerosols, has been formulated theoretically and shown to be in good agreement with extensive experiments. The mechanism of ion-induced condensation may be relevant in the Earth’s atmosphere under pristine conditions, and able to influence the formation of CCN. It is conjectured that this mechanism could be the explanation for the observed correlations between past climate variations and cosmic rays, modulated by either solar activity or supernova activity in the solar neighborhood on very long time scales. The theory of ion-induced condensation should be incorporated into global aerosol models, to fully test the atmospheric implications.
The idea of a significant solar influence on climate change via cloud cover produced by cosmic rays has been proposed many times but it lacked conclusive experimental evidence as well as a detailed theoretical framework. Some have labelled the idea controversial with, at best, a weak effect. The principle is that cosmic rays – high-energy particles that traverse the galaxy from supernovae – knock electrons out of air molecules. This produces ions – electrically positive and negative molecules in the atmosphere. The ions help aerosols – clusters of mainly sulphuric acid and water molecules – to form and become stable against evaporation – a process is called nucleation. The problem was that small aerosols need to grow nearly a million times in mass in order to have an effect on cloud formation. Until now, it was not known how this could happen.
Scientists have quantified the relationship between natural sources of particles in the atmosphere and climate change. Their research shows that the cooling effect of natural atmospheric particles is greater during warmer years and could therefore slightly reduce the amount that temperatures rise as a result of climate change.Share:
Geologist Dr. Norman Page left a comment which I’ve decided to upgrade to a post. In it he writes solar and La Nina observations fit well with his recent paper showing that climate is controlled by natural orbital and solar activity cycles.
Dr. Page is among a growing number of scientists who share the general view that natural solar and oceanic cycles are mostly driving the climate, just as they always have in the past.
This study gives irrefutable evidence on the persistence of atoll reef islands in French Polynesia over the last five decades, as 92% of the 111 islands studied exhibited either areal stability or expansion since the 1960s. Only 8% of the 111 islands showed contraction in area. Tropical cyclone waves contributed to island upward growth, which reached up to 1 m in places, through the transfer of sediments up onto the island surface.
Hopefully, the first two posts in this series, “Do humans harm the environment” and “Population Growth and the Food Supply” have convinced the reader that man-made climate change and global warming are not an existential threat to humanity or the planet. This leaves us in a discussion of the cost of global warming, which is something we can calculate. To do the calculation, we need to estimate the monetary damages caused by global warming, when they will be incurred, and the discount rate of money over that period of time. We will not attempt the calculation here, it is too complex, but we can discuss the parameters and some of the calculations done by others.
We’re told that climate change caused or intensified California’s wildfires — and that such fires are getting worse. As usual for such scary stories, these claims are only weakly supported by science — except for the ones that are outright fabrications. See what scientists say and decide for yourself.
(…) All of these press releases appeared within a couple of hours of each other on EurekAlert, which is a Science PR clearing house. They will all inevitably get turned into stories by the media. Who could blame the public for being confused when we have such certainty/uncertainty battles like this going on in climate science?
It seems Yogi Berra was right.
It’s tough to make predictions, especially about the future.
This is going to rattle some cages, while at the same time vindicating Dr. Roger Pielke Jr. A new study in Geophysical research Letters studies hurricane activity in the Atlantic concludes that a “statistically significant downward trend since 1950 exists”.
An Energetic Perspective on United States Tropical Cyclone Landfall Droughts
Authors Ryan E. Truchelut, Erica M. Staehling
Essay by Dr. Susan Crockford (republished from her website https://polarbearscience.com )on Retraction request to Bioscience: FOIA emails document another harsh criticism of Amstrup’s 2007 polar bear model
Today I sent a letter to the editors of the journal Bioscience requesting retraction of the shoddy and malicious paper by Harvey et al. (Internet blogs, polar bears, and climate-change denial by proxy) published online last week.
The letter reveals information about the workings of the polar bear expert inner circle not known before now, so grab your popcorn.
From the ‘scare tactical modeling’ department comes this press release today, which has been circulating to news media until the embargo lifted this morning. You’ll see all sorts of caterwauling from the usual media outlets about how global warming is even worse now, and the future looks grim.
(…) Petroleum geologists tend to be sedimentary geologists and sedimentary geology is essentially a combination of paleogeography and paleoclimatology. Depositional environments are defined by physical geography and climate. We literally do practice in a different world, the past. Geologists intuitively see Earth processes as cyclical and also tend to look at things from the perspective of “deep time.” For those of us working the Gulf of Mexico, we “go to work” in a world defined by glacioeustatic and halokinetic processes and, quite frankly, most of us don’t see anything anomalous in recent climate changes.
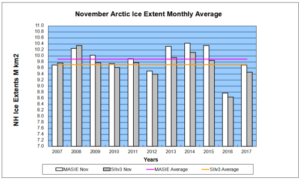
By now, after some 30 years of dire warnings, you’d think that the warming of the globe and ice mass reduction would be much further along than it actually is. Yet there are a number of major signs that show the opposite (cooling and freezing) are happening (…)
Earlier observations showed that Arctic ice extents were low in the 1940s, grew thereafter up to a peak in 1977, before declining. That decline was gentle until 1994 which started a decade of multi-year ice loss through the Fram Strait. There was also a major earthquake under the north pole in that period. In any case, the effects and the decline ceased in 2007, 30 years after the previous peak. Now we have a plateau in ice extents, which could be the precursor of a growing phase of the quasi-60 year Arctic ice oscillation.
The average global temperature drop between October and November, 2017, tied for the fifth largest one-month-to-the-next drop in the 39-year satellite temperature record, according to Dr. John Christy, director of the Earth System Science Center (ESSC) at The University of Alabama in Huntsville. Compared to seasonal norms, the average temperature around the globe fell 0.27 C (almost 0.49 degrees F) between October and November. (The largest drop was from January to February 2013, when the global average temperature fell 0.32 C.)
by Rupert Darwall, November 28, 2017 in CompetitiveEnterpriseInstitut
This essay by Rupert Darwall explores the expressions of public certainty by climate scientists versus the private expressions of uncertainty, in context of a small Workshop on Climate organized by t he American Physical Society (APS). I was privileged to participate in this workshop, which included three climate scientists who support the climate change consensus and three climate scientists who do not — all of whom were questioned by a panel of disting uished physicists (…).
Les prévisions climatiques à très long terme (2100) sont établies à l’aide de modèles qui ne sont rien d’autre des logiciels très complexes, dont le but est de reproduire le comportement du climat terrestre.
Comme on ne peut pas décrire ce qui se passe en tous les points de la terre, celle-ci est découpée en mailles de quelques centaines de kilomètres de côté. Les modèles utilisés par le GIEC pour son cinquième rapport d’évaluation (2013) avaient des résolutions relativement grossières (supérieures à 100 km). La situation évolue toutefois rapidement et les modèles climatiques les plus récents auraient une résolution plus fine (de l’ordre de 20 km).