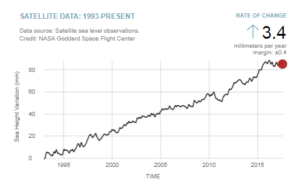
This is interesting. It appears that a “pause” has developed in global sea levels. For two years, since July 2015, there has been no sustained increase in global sea level, in fact, it appears to have actually fallen a bit. This graph, provided by NASA’s Global Climate Change website, tells the story:
Temperature and Water Level (MSL) are two hot topic measurements being widely bandied about and vast sums of money are being invested in research to determine whether, on a global scale, these physical quantities — Global Average Temperature and Global Mean Sea Level — are changing, and if changing, at what magnitude and at what rate. The Global Averages of these ever-changing, continuous variables are being said to be calculated to extremely precise levels — hundredths of a degree for temperature and millimeters for Global Sea Level — and minute changes on those scales are claimed to be significant and important.
Dans quelle mesure les émissions anthropiques qui s’élèvent à 9 Giga Tonnes par an (dont 1,5 dues au changement d’utilisation des sols) perturbent le cycle du carbone contribuant à l’augmentation de la concentration de CO2 dans l’atmosphère?
Georgiou, et al. 2015 have reported that coral reefs in the Australian Great Barrier Reef, near Heron Island, are insensitive to ocean pH changes. The location of Heron Island, about 257 miles (414 km) north of Brisbane, Queensland, Australia, is shown in figure 1 using Google maps
There are two important points which readers must be aware of from the first mention of Sea Level Rise (SLR):
SLR is a real concern to coastal cities, low-lying islands and coastal and near-coastal densely-populated areas. It can be real problem. See Part 1 of this series.
SLR is not a threat to much else — not now, not in a hundred years — probably not in a thousand years — maybe, not ever. While it is a valid concern for some coastal cities and low-lying coastal areas, in a global sense, it is a fake problem.
A Russian team, however, has been active establishing a chronology of deuterium from snow-cores and -pits near the Vostok station (A.A. Ekaykin, et al., 2014). A summary (www.ncdc.noaa.gov/paleo/study/22532) with digital data became available in May, 2017. The data include annual measurements from 1654 to 2010, providing an overlap with the ice-core record that enables an assessment of present conditions from the perspective of ice-core record.
It was late evening, April 19, 1995, that the crestfallen figure of McArthur Wheeler could be found slumped over a Pittsburgh Police Department’s interrogation room table. Forlorn and understandably distressed by his predicament, he could be heard muttering dumbfounded astonishment at his arrest. “I don’t understand it,” he would repeat, “I wore the juice, I wore the juice!” (. . .)
A year ago I wrote an article at WUWT analyzing the recent upward trend in summer Arctic sea ice extent. Despite challenges of statistical irrelevancy, the trend has continued another year. Arctic ice experts, that have repeatedly predicted the demise of summer ice, don’t have an explanation for a 10-year trend that contradicts their predictions, beyond statistical variability or unexplained natural variability.
Debate and controversy concerning the issue of climate change generally results in the hindering and obstruction of social and governmental action on this issue. This paper analyses the scientific background, i.e. the reference list of the IPCC Fifth Assessment Report ‘‘The Physical Science Basis’’ and an alternative climate change report of a US think tank institute ‘‘Climate Change Reconsidered II. Physical Science’’.
The period from 2000 to 2016 shows a modest warming trend that the advocates of the anthropogenic global warming theory have labeled as the “pause” or “hiatus.” These labels were chosen to indicate that the observed temperature standstill period results from an unforced internal fluctuation of the climate (e.g. by heat uptake of the deep ocean) that the computer climate models are claimed to occasionally reproduce without contradicting the anthropogenic global warming theory (AGWT) paradigm. In part 1 of this work, it was shown that the statistical analysis rejects such labels with a 95% confidence because the standstill period has lasted more than the 15 year period limit provided by the AGWT advocates themselves.
by Nicole Jacobs, October 3, 2017 in ClimateChangeDispatch
The report, which bases its CO2 emissions estimates off International Energy Agency (IEA) and BP data through 2016, found the global CO2 levels essentially remained flat in 2015 and 2016. As BP noted earlier this year, the global trend is “well below the 10-year average growth of 1.6% and a third consecutive year of below-average growth” and that “during 2014-16, average emissions growth has been the lowest over any three-year period since 1981-83.”
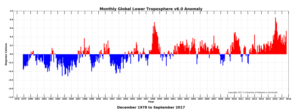
Boosted by warmer than normal water in the equatorial eastern Pacific Ocean that peaked in June and July, global average temperatures in the atmosphere rose to record levels in September, according to Dr. John Christy, director of the Earth System Science Center at The University of Alabama in Huntsville. Not only was it the warmest September on record, it was also the warmest month (compared to seasonal norms) in the 38-year satellite temperature record that wasn’t associated with an “officially recognized” El Niño Pacific Ocean warming event.
Tropical cyclones in the Australian region are influenced by a number of factors, and in particular variations in the El Niño – Southern Oscillation. In general, more tropical cyclones cross the coast during La Niña years, and fewer during El Niño years.
Analysis of historical tropical cyclone data has limitations due to a number of changes in observing practices and technology that have occurred over time. With new and improved meteorological satellites our ability to detect tropical cyclones has improved, as has our ability to differentiate tropical cyclones from other tropical weather systems such as monsoon depressions, which in the past may have been incorrectly named as tropical cyclones. A particularly important change occurred in the late 1970s when regular satellite images became first available from geostationary satellites above the Earth’s equator.
(…) We are left with conjectures and other speculation, both in the recent past and for the future. For this, climatologists develop models with which they can test their hypotheses. But these models are obviously overheating. (…)
Global methane emissions from agriculture are larger than estimated due to the previous use of out-of-date data on carbon emissions generated by livestock, according to a study published in the open access journal Carbon Balance and Management.
In the last 4 months, 40 more graphs taken from 30 more new peer-reviewed scientific papers have made their way into the ever-growing volume of evidence that today’s climate is not only not unprecedented or unusual in the context of the last millennium, but modern temperature values are still among the coldest of the last 10,000 years.
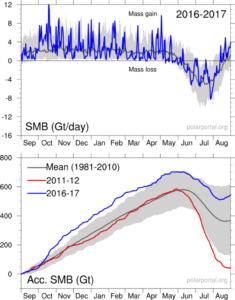
Overall, initial figures suggest that Greenland may have gained a small amount of ice over the 2016-17 year. If confirmed, this would mark a one-year blip in the long-term trend of year-on-year declines over recent decades.
by Tony Heller, September 29, 2017 in DeplorableClimSciBlog
Ninety years ago brought the worst floods in US history. The Mississippi River was flooded for more than six months, forcing hundreds of thousands of people to abandon their homes permanently. Vermont’s worst flood on record occurred in November, 1927. The Red Cross described 1927 as the worst year in history.
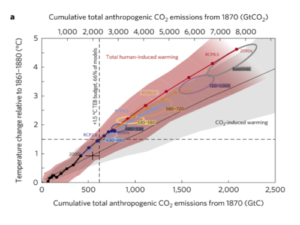
A number of authors, including the IPCC, have argued that climate models have systematically overstated the rate of global warming in recent decades. A recent paper by Millar et al. (2017) presented the same finding in a diagram of temperature change versus cumulative carbon emissions since 1870.
In the climate debate, though, it pays to read the small print. Official climatology does not usually admit its many errors: instead, we are ordered to obey the “consensus”, as the Party Line is these days rebranded. On reading the headlines, I suspected at once that the true purpose of the latest admission, by Millar et al. in the current issue of Nature Geo“science”, is to minimize and thus to conceal the true magnitude of past over-predictions.
Solar activity during the current sunspot minimum has fallen to levels unknown since the start of the 20th century. The Maunder minimum (about 1650–1700) was a prolonged episode of low solar activity which coincided with more severe winters in the United Kingdom and continental Europe. Motivated by recent relatively cold winters in the UK, we investigate the possible connection with solar activity. We identify regionally anomalous cold winters by detrending the Central England temperature (CET) record using reconstructions of the northern hemisphere mean temperature.
L’incroyable nouvelle a été annoncée par Mathieu Vidard dans l’émission La Tête au carrésur France Inter, le 20 septembre 2017 (ici, très brièvement, à partir de 10’, il faut bien viser) :
Maintenir le réchauffement climatique en dessous de 1,5°C, c’est encore possible, c’est l’objectif qui avait été fixé par les Accords de Paris à l’issue de la COP 21. La bonne nouvelle vient d’une équipe de recherche internationale. D’après leurs analyses, l’ampleur du réchauffement climatique qui a déjà eu lieu a été surestimée et la quantité de carbone que l’humanité peut émettre à partir de 2015 en restant en-dessous de ce seuil de 1,5°C serait trois fois supérieure à ce qui avait été annoncé.