Archives de catégorie : climate-debate

LIST OF HISTORICAL TEMPERATURE EXTREMES BY U.S. STATE SHOWS NO SIGN OF GLOBAL WARMING

by Cap Allon, Oct 10, 2020 in Electroverse


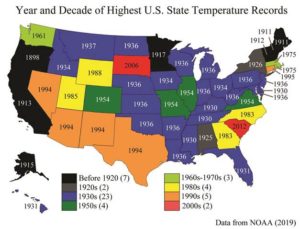
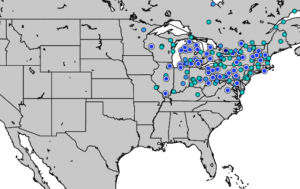
Below I’ve compiled a list of the hottest and coldest temperatures ever recorded in each U.S. state, according to NOAA data. Surely, if catastrophic global warming was actually a thing then it would show up in the temperature records. Spoiler: it doesn’t, and a discussion on why follows the list.

ALABAMA

– All-time highest temperature: 112° F (Centreville on Sept. 6, 1925)

– All-time lowest temperature: -27° F (New Market 2 on Jan. 30, 1966)

ALASKA

– All-time highest temperature: 100° F (Fort Yukon on June 27, 1915)

– All-time lowest temperature: -80° F (Prospect Creek on Jan. 23, 1971)

ARIZONA

– All-time highest temperature: 128° F (Lake Havasu City on June 29, 1994)

– All-time lowest temperature: -40° F (Hawley Lake on Jan. 7, 1971)

ARKANSAS

All-time highest temperature: 120° F (Ozark on Aug.10, 1936)

– All-time lowest temperature: -29° F (Gravette on Feb.13, 1905)

CALIFORNIA

– All-time highest temperature: 134° F (Greenland Ranch on July 10, 1913)


WISCONSIN

– All-time highest temperature: 114° F (Wisconsin Dells on July 13, 1936)

– All-time lowest temperature: -55° F (Couderay 7 W on Feb. 4, 1996)

WYOMING

– All-time highest temperature: 115° F (Basin on Aug. 8, 1983)

– All-time lowest temperature: -66° F (Riverside Ranger Station, Yellowstone National Park) on Feb. 9, 1933)

More than 210 degrees Fahrenheit separates the highest and the lowest temperatures on record in the United States, and it isn’t a coincidence that the majority of these temperatures records –for both hot and cold– occur during solar minimums.

This is because low solar activity weakens the jet stream, reverting its usual tight ZONAL flow to more of a wavy MERIDIONAL one. This violent “buckling” effect FULLY explains how regions can experience pockets of anomalous heat while others, even relatively nearby, can be dealing with blobs of record cold: basically, in the NH, Arctic cold is dragged anomalously far south and Tropical warmth is pushed unusually far north (for more see the two links below)

New book: Climate Change: The Facts 2020

by A. Watts, Oct 8, 2020 in WUWT


The Institute of Public Affairs today announced the release of a significant new book of research Climate Change: The Facts 2020 published by the Institute of Public Affairs and Australian Scholarly Publishing.

On 24 September 2019, the 17-year-old activist Greta Thunberg addressed the United Nations Climate Action Summit saying, “People are suffering. People are dying. Entire ecosystems are collapsing. We are in the beginning of a mass extinction.” A day earlier, however, the climate policy foundation Climate Intelligence (CLINTEL) sent the UN their World Climate Declaration, signed by 800 prominent scientists including Nobel Laureate Professor Ivar Giaever and Greenpeace co-founder Dr. Patrick Moore, stating that there is no climate emergency: “You’re tired of alarmism and failed predictions of climate models that can’t predict the past, let alone the future. You distrust the business leaders, politicians and scientists of the climate industrial complex – you just want The Facts.”

This book contains original research and new theories of climate and will arm you with these facts. Leading scientists are contributors, including former Senior Scientist for Climate Studies at NASA’s Marshall Space Center Dr. Roy Spencer, and lead author of the Intergovernmental Panel on Climate Change’s Third Assessment Report Professor Emeritus of Meteorology Richard Lindzen of Massachusetts Institute of Technology, and many more.

Climate Change: The Facts 2020 is the definitive guide to the latest international research and analysis on climate change science and policy.  Twenty experts in their field from across five countries have written original contributions on the key issues of scientific, political, and public debate about climate change.

​Some of the issues addressed in chapters in Climate Change: The Facts 2020 include:

  • the extent and variability of sea level change
  • the historical record of temperature and ice coverage in the Antarctic
  • the impact of climate change on polar bear populations
  • the manipulation of temperature data by the Bureau of Meteorology
  • whether the Australian bushfires 2019-20 were in fact ‘unprecedented’; and

the prevalence of ‘noble cause’ corruption in climate science.

Corona-induced CO2 emission reductions are not yet detectable in the atmosphere

by Karlsruher Institut für Technology, Sep 21, 2020 in EurekAlert


Based on current data measured in the energy, industry, and mobility sectors, restrictions of social life during the corona pandemic can be predicted to lead to a reduction of worldwide carbon dioxide emissions by up to eight percent in 2020. According to the Intergovernmental Panel on Climate Change (IPCC), cumulative reductions of about this magnitude would be required every year to reach the goals of the Paris Agreement by 2030. Recent measurements by researchers of Karlsruhe Institute of Technology (KIT) revealed that concentration of carbon dioxide (CO2) in the atmosphere has not yet changed due to the estimated emission reductions. The results are reported in Remote Sensing (DOI: 10.3390/rs12152387).


See also here =  Can We Measure a COVID-19-Related Slowdown in Atmospheric CO2 Growth? Sensitivity of Total Carbon Column Observations

A HISTORY OF CLIMATE FRAUD (I)

by Cap Allon, oct 5, 2020 in Electroverse


Much of the below analysis is courtesy of Kenneth Richard.

The combined Hadley Centre and Climatic Research Unit (HadCRUT) data set –which is featured in IPCC reports– underwent a revision from version 3 to version 4 in March of 2012, about a year before the next IPCC report was due.

At the time (early 2012), the HadCRUT3 was showing a slight global cooling trend between 1998 and 2012, visible in the graph below which uses HadCRUT3 and HadCRUT4 raw data. In conjunction with changing versions, the slight cooling trend had convenientlychanged to a slight warming trend:


As recently as 1990, it was widely accepted that the global temperature trend showed a “0.5°C rise between 1880 and 1950”, as reported by NASA (Hansen and Lebedeff, 1987). This rise (as well as the 0.6C rise between 1880 and 1940) can clearly be seen in the NASA GISS graph from 1987:

Michael Mann Appeals to, Then Ignores Scientific Consensus on 60 Minutes

by James Taylor, Oct 5, 2020 in WUWT


Prominent scientist and climate activist Michael Mann appealed to an asserted scientific consensus to chastise President Donald Trump on CBS’s 60 Minutes program last night. Ironically, Mann himself ignored clear scientific consensus in order to promote his own, out-of-the-mainstream climate change theories.

While interviewing Mann, CBS’s Scott Pelley said, “There have always been fires in the West. There have always been hurricanes in the East. How do we know that climate change is involved in this?” Pelley followed up with, “The president says about climate change, ‘Science doesn’t know.’”

Replied Mann, “The president doesn’t know, and he should know better. He should know that the world’s leading scientific organizations, our own U.S. National Academy of Sciences, and national academies of every major industrial nation, every scientific society in the United States that’s weighed in on the matter. This is a scientific consensus. There’s about as much scientific consensus about human-caused climate change as there is about gravity.”

Mann’s description of the conclusions of the “scientific consensus” however, is exactly the opposite of what scientific bodies report.

As documented in Climate at a Glance: Hurricanes, the United Nations Intergovernmental Panel on Climate Change (IPCC) expresses “low confidence” in any connection between climate change and changes in hurricane activity.

Similarly, as documented in Climate at a Glance: U.S. Wildfires, U.S. wildfires are much less frequent and severe than they were in the first half of the 20th century – 100 years of global warming ago. Moreover, the IPCC reports a decrease in drought conditions – which is the primary climate factor regarding wildfires – in the global region including the U.S. West. Moreover, the IPCC finds no evidence of an increase in drought globally, either.

Ultimately, data, evidence, and scientific facts are far more indicative of scientific truth than a real or imagined consensus of scientists. Yet, to the extent Michael Mann wishes to invoke consensus as a scientific argument, the clear consensus of scientists is that Mann is promoting extreme climate theories that have no basis in reality.

Restoring Scientific Debate on Climate

by Jim Steele, Oct 3, 2020 in WUWT


The political genius of Abraham Lincoln’s efforts to unify the country during America’s most divisive time has been attributed to assembling a “team of rivals”. Likewise, scientific research is published so rivals and supporters of a hypothesis can independently and critically examine it. The great benefits of a team of rivals is also the basis for convening red team/blue team debates.

In 2017, Dr Steve Koonin, a physicist who served as Obama’s Undersecretary for Science in the US Department of Energy, urged convening red-team blue-team debates for climate science in his article A ‘Red Team’ Exercise Would Strengthen Climate Science.  “The national-security community pioneered the “Red Team” methodology to test assumptions and analyses, identify risks, and reduce—or at least understand—uncertainties. The process is now considered a best practice in high-consequence situations”.

Unfortunately, the public climate science debate has been framed as “deniers” versus “alarmists”, or “honest saintly scientists” versus “corrupt perpetrators of a hoax”.  The media pushes exaggerated claims of a crisis while some scientists misleadingly shield their hypotheses claiming the “science is settled”.  But science is a process and never settled. However, all sides do agree carbon dioxide is a greenhouse gas and concentrations have increased. All sides agree the climate is changing. That science is indeed settled. But complex climate dynamics are not driven solely by CO2 and many unsettled questions remain.  Scientists still debate whether climate has a higher or lower sensitivity to rising CO2. Answering that question depends on the unsettled science regards competing contributions from natural variability and landscape changes. And because rising CO2 and warmth benefits photosynthesizing plants, scientists debate the beneficial contributions of rising CO2.

Climate models could not replicate recent warming when only natural climate change was considered. But models could simulate recent warming since 1970s after adding CO2. That was the only evidence that supported the notion that increasing CO2 caused observed warming. However, there’s a flaw in such reasoning. Models limited to just natural climate dynamics failed to explain recent changes simply because our understanding is still incomplete. For example the Pacific Decadal Oscillation, a major driver of natural climate change was only recently characterized in 1997, but has been shown to account for 100 years of changing climate along the coasts of the north eastern Pacific.


Urban Heat Island profile Image from Lawrence Berkeley Labs

Ice discharge in the North Pacific set off series of climate events during last ice age

by Oregon State University, Oct 1, 2020 in Science Daily


Repeated catastrophic ice discharges from western North America into the North Pacific contributed to, and perhaps triggered, hemispheric-scale changes in the Earth’s climate during the last ice age, new research published online today in Science reveals.

The discovery provides new insight into the impact rapidly melting ice flowing into the North Pacific may have on the climate across the planet, said Maureen Walczak, a paleoclimatologist in Oregon State University’s College of Earth, Ocean, and Atmospheric Sciences and the study’s lead author.

“Understanding how the ocean has interacted with glacial ice in the past helps us predict what could happen next,” Walczak said.

The Cordilleran ice sheet once covered large portions of western North America from Alaska to Washington state and western Montana. Radiocarbon dating and analyses of the marine sediment record revealed that recurrent episodes of discharge from this ice sheet over the past 42,000 years were early events in a chain reaction of disturbances to the global climate. These disturbances triggered changes in deep ocean circulation and retreat of ice sheets in the North Atlantic.

Data Show Canadian Wildfires At Lowest Level In Decades

by A. Watts, Sep 29, 2020 in WUWT


Here’s something surprising from Paul Homewood, Not A Lot Of People Know That. While USA wildfires are running higher the last couple of years, according to Canada’s National Forestry Database, the number of forest fires in Canada has been at the lowest since 1990. Of course, Canada takes a management approach to forests compared to the USA’s “let it be or litigation” mess.

Source: http://nfdp.ccfm.org/en/data/fires.php

According to the Met Office, global warming is leading to record breaking fires in North America.

Canada, of course, is a large part of North America, so surely fires should be getting worse there too.

In fact wildfires this year are running at just 8% of the 10-year average:


Study: Global Warming Hiatus (aka “The Pause”) Was Real

by A. Watts, Sep 28, 2020 in WUWT


From the GWPF and the better late than never department: (the paper was published in late 2019 but seems pretty solid, using Oxygen18 isotope analysis) – Anthony

A new analysis of global air temperature by researchers from Tongji University in Shanghai has cast light on the much debated recent hiatus in global temperature.

Writing in the Journal of Earth Science the Chinese scientists say there was a rapid rise in global mean surface air temperature after the late 1970s but that this stalled and there was a relative stagnation and even slight cooling that lasted for about 15 years (1998–2012). They add that even though the slowdown was acknowledged by the Intergovernmental Panel on Climate Change Fifth Assessment Report (IPCC AR5) and termed as a hiatus (IPCC, 2013) there was a debate in the scientific community about whether there was a hiatus in global warming or not.

The researchers believe that the debate about the global warming hiatus poses a substantial challenge to our understanding of the global climate response to anthropogenic greenhouse gas emissions and natural variability. They say that the disagreements about the recent global warming hiatus mainly arise from different sources, among which differences across observational SAT datasets may be a key contributor to the contradictory conclusions. So they use an alternative set of data.

They use the ratio of two oxygen isotopes in precipitation, oxygen 16 and 18, which is a proxy for the temperature of precipitation and surface temperature. They are particularly interested in what they term a “robust correlation” between precipitation oxygen ratios and surface temperature over mid- and high-latitude regions. Twelve stations were selected of which ten are located in Europe, and the remaining two in Antarctica and North America, respectively. Using the data they constructed a composite isotope index spanning 1970–2016 by combining twelve precipitation oxygen isotope records collected over mid and high-latitude continents. With it they evaluate the recent global warming hiatus.

Continuer la lecture de Study: Global Warming Hiatus (aka “The Pause”) Was Real

OUT-OF-SEASON SNOW BLANKETS BOTH HEMISPHERES

by Cap Allon, Sep 29, 2020 in Electroverse


A merdional (wavy) jet stream flow is diverting brutal polar air to the mid-latitudes in BOTH hemispheres. Every continent on the planet is currently receiving out-of-season snow and anomalous cold, with a few of the worst hit nations being New Zealand, Australia, the United States, and France.


NEW ZEALAND

A spring weather bomb has battered New Zealand, closing roads, dumping snow on beaches and causing dozens of flight cancellations.

The NZ Met service has described the low-pressure system moving up the country from Antarctica as “very unusual in how widespread and severe the weather is” — they have called it a significant weather event.

The National Institute for Water and Atmospheric Research said parts of the South Island shivered through record-breaking lows of -20C (-4F) on Monday and Tuesday.

Flights were cancelled up and down the South Island due to heavy snow.

Disruptive flurries were even reported a sea-level: very unusual for spring:

11 SCIENTIFIC PREDICTIONS FOR THE UPCOMING GRAND SOLAR MINIMUM

by Cap Allon, Sep 18, 2020 in Electroverse


 There is ever-mounting evidence warning the next epoch will be one of sharp terrestrial cooling due to a relative flat-lining of solar output.

The exact time-frame and depth of this next chill of solar minimum is still anyone’s guess, and the parameters involved (i.e., galactic cosmic rays, geomagnetic activity, solar wind flux etc.) remain poorly understood. However, there are some great minds on the job, and below I’ve collated 11 best-guesses based on published scientific papers from respected researchers in the field. The list begins with eminent Russian astrophysicist K. Abdussamatov–though it is in no particular order.

In Parts Of Japan, Mean Maximum Temperatures May Be More Impacted By Remote Ocean Cycles Than By CO2

by P. Gosselin, Sep 26, 2020 in NoTricksZone


Today, according to government scientists, CO2 is supposed to be the dominant climate driver, overwhelming all the other power natural forces such as solar variability and oceanic cycles.

Map (right): JMA

Yet when we compare (untampered) datasets, we often find surprising parallels and underlying correlations with these now ignored natural factors, which tell us CO2 isn’t what the activists want us to believe it is and that things are really much messier than the simplistic CO2-temperature correlation.

Today we look at a plot of the annual mean daily maximum temperature from Uwajima, Japan, together with the plot of the Atlantic Multidecadal Oscillation (AMO) going back almost 100 years.

Data: data.jma.go.jp/ / psl.noaa.gov/

Of course, nothing in a complex system like climate is going to show a perfect correlation, yet the above general fit is quite remarkable, which thus suggests regions are climatically interconnected in many yet to be understood ways. Such things aren’t accidental.

In summary: climate science is far from being understood, let alone settled. Anyone suggesting otherwise is likely just trying to sell you a bridge in Brooklyn – or they simply don’t know much about the subject and only parroting media sound bites.

Global Warming Drives Wildfires Study–Ignores Pre 1979 Data

by P. Homewood, Sep 25, 2020 in WUWT


Climate change is driving the scale and impact of recent wildfires that have raged in California, say scientists.

Their analysis finds an “unequivocal and pervasive” role for global heating in boosting the conditions for fire.

California now has greater exposure to fire risks than before humans started altering the climate, the authors say.

Land management issues, touted by President Donald Trump as a key cause, can’t by themselves explain the recent infernos.

The new review covers more than 100 studies published since 2013, and shows that extreme fires occur when natural variability in the climate is superimposed on increasingly warm and dry background conditions resulting from global warming.

“In terms of the trends we’re seeing, in terms of the extent of wildfires, and which have increased eight to ten-fold in the past four decades, that trend is driven by climate change,” said Dr Matthew Jones from the University of East Anglia in Norwich, UK, who led the review.

“Climate change ultimately means that those forests, whatever state they’re in, are becoming warmer and drier more frequently,” he told BBC News.

“And that’s what’s really driving the kind of scale and impact of the fires that we’re seeing today.”

In the 40 years from 1979 to 2019, fire weather conditions have increased by a total of eight days on average across the world.

However, in California the number of autumn days with extreme wildfire conditions has doubled in that period.

The authors of the review conclude that “climate change is bringing hotter, drier weather to the western US and the region is fundamentally more exposed to fire risks than it was before humans began to alter the global climate”.

https://www.bbc.co.uk/news/science-environment-54278988

Now why should they start their study in 1979? After all, there is loads of data from earlier years.

A look at NOAA’s rainfall graph for California shows just why:

https://www.ncdc.noaa.gov/cag/national/time-series

CLINTEL puts hard climate questions to Bill Gates

by D. Wojick, Sep 23, 2020 in CFACT


Bill Gates is throwing several billion dollars at climate change. Mind you he is not throwing it away, because it is mostly venture capital for new energy technologies, which could pay off handsomely without climate change.

Gates can do what he likes with his riches, but he is a leading figure and lately he has become a serious climate change scaremonger. This has prompted CLINTEL to put some hard questions to him, in the form of a registered letter.

On the scaremongering side, last month Gates published an article claiming that climate change will be far worse than the present Covid outbreak. He imagines many millions dying from climate change. The press spread his doomsday words far and wide.

Here are some doomful excerpts:

I am talking about COVID-19. But in just a few decades, the same description will fit another global crisis: climate change. As awful as this pandemic is, climate change could be worse.

I realize that it’s hard to think about a problem like climate change right now. When disaster strikes, it is human nature to worry only about meeting our most immediate needs, especially when the disaster is as bad as COVID-19. But the fact that dramatically higher temperatures seem far off in the future does not make them any less of a problem—and the only way to avoid the worst possible climate outcomes is to accelerate our efforts now. Even as the world works to stop the novel coronavirus and begin recovering from it, we also need to act now to avoid a climate disaster by building and deploying innovations that will let us eliminate our greenhouse gas emissions.”

The unfortunate ‘climate anomaly’ of the First World War revealed

by P. Homewood, Sep 4, 2020 in NotaLotofPeopleKnowThat


A new research paper states this anomalous weather coincided with battles where: “The mud and water‐filled trenches and bomb craters swallowed everything, from tanks, to horses and troops, becoming what eyewitnesses described as the ‘liquid grave’ of the armies.”

Prof Alexander F More, who led the research for Harvard, explained: “Atmospheric circulation changed and there was much more rain, much colder weather all over Europe for six years.” “It was a once in a 100-year anomaly.”

This anomaly wreaked havoc on battlefields beginning with the First Battle of Champagne in 1914 , where British, French, and German troops suffered flooded trenches and frostbite while mud “slowed down the movement of troops and artillery”.

The Somme and Verdun in 1916, and the Third Battle of Ypres-Passchendaele in 1917, were slogged out in quagmires caused by the freak downpours which increased casualties.

Royal Artillery signaller John Palmer described his trauma at seeing men “sinking into the slime, dying in the slime” on the Western Front.

WOW!! And no mention of CO2!

Claim: Svalbard glaciers lost their protective buffer in the mid-1980s and have been melting ever since

by B. Noel & M.  van den Broeke, Sep  23, 2020 in WUWT/U.Utrecht


The archipelago of Svalbard, a land of ice and polar bears, is found midway between mainland Norway and the North Pole. Its capital Longyearbyen on the main island of Spitsbergen is the world’s most northerly city, some 800 miles inside the Arctic Circle.

Svalbard is also home to some of the Earth’s northernmost glaciers, which bury most of the archipelago’s surface under no less than 200 metres of thick ice. Taken together, Svalbard glaciers represent 6% of the worldwide glacier area outside the large ice sheets of Greenland and Antarctica – if they totally melted, they would raise the sea level by 1.7cm.

Svalbard is roughly the size of Ireland or Sri Lanka, but largely covered in ice. Google Maps

Determined Scientists Add Phantom ‘Unprecedented’ Warmth To New Temperature Reconstructions

by K. Richard, Sep 21, 2020 in NoTricksZone


Paleoclimate reconstructions that find no unusual modern warming are nonetheless characterized as showing sharp temperature increases in recent decades anyway.

A new (Li et al., 2020) 1818-2012  temperature reconstruction determined 1955 (6.33 °C) and 2001 (7.17 °C) were the 1st and 5th coldest years in northeastern China in the last 200 years. The two warmest years were 1832 (9.63 °C) and 1900 (9.57 °C).

Further, the highest “continuous high decadal temperatures” recorded were in 1818–1844 and 1856–1873. The post-1950s temperatures were colder than nearly all of the first 100 years of the temperature record.

And yet in spite of the warmer 19th-century temperatures, the authors chracterize the slight temperature rise since the 1950s as heralding  in “unprecedented” warming. They make this claim (of “unprecedented” recent warmth) in both the paper’s textual and graphical abstracts.


Image Source: Li et al., 2020


Forbes et al. (2020) use thermometer data from an Alaskan airport for the last ~90 years of their temperature record. The instrumentals show surface temperatures cooled -0.7°C in winter (January) and warmed 0.8°C in summer (July) from the 1950s-’80s decades to the 1990s to 2010s.

For the summer temperature record (shown in red below), nearly all the warming occurred during a step-change from the mid-1970s to mid-1980s. Since about 1985, summer temperatures seem to have been stable to slightly declining.

A lack of net overall warming in the last 50 or 60 years does not advance the anthropogenic global warming (AGW) cause, of course.

Solar panels generate mountains of waste

by D. Flanakin, Sep 19, 2020 in WUWT


They also heat the planet, blanket wildlife habitats and cause other ecological damage

The problem of solar panel waste is now becoming evident. As environmental journalist Emily Folk admits in Renewable Energy Magazine, “when talking about renewable energy, the topic of waste does not often appear.” She attributes this to the supposed “pressures of climate change” and alleged “urgency to find alternative energy sources,” saying people may thus be hesitant to discuss “possible negative impacts of renewable energy.”

Ms. Folk admits that sustainability requires proper e-waste management. Yet she laments, “Solar presents a particular problem. There is growing evidence that broken panels release toxic pollutants … [and] increasing concern regarding what happens with these materials when they are no longer viable, especially since they are difficult to recycle.”

This is the likely reason that (except in Washington state), there are no U.S. mandates for solar recycling. A recent article in Grist reports that most used solar panels are shipped to developing countries that have little electricity and weak environmental protections, to be reused or landfilled.

The near-total absence of end-of-life procedures for solar panels is likely a byproduct of the belief (and repeated, unsupported assertion) that renewable energy is “clean” and “green.” Indeed, Mississippi Sierra Club state director Louie Miller recently claimed that unlike fossil fuels and nuclear energy, “Sunshine is a free fuel.” Well, sunshine is certainly free and clean. However, there is a monumental caveat.

Harnessing sunshine (and wind) to serve humanity is not free – or clean, green, renewable or sustainable.

Sector by sector: where do global greenhouse gas emissions come from?

by H. Ritchie, Sep 18, 2020, in OurWorldlinData


To prevent severe climate change we need to rapidly reduce global greenhouse gas emissions. The world emits around 50 billion tonnes of greenhouse gases each year [measured in carbon dioxide equivalents (CO2eq)].

To figure out how we can most effectively reduce emissions and what emissions can and can’t be eliminated with current technologies, we need to first understand where our emissions come from.

In this post I present only one chart, but it is an important one – it shows the breakdown of global greenhouse gas emissions in 2016. This is the latest breakdown of global emissions by sector, published by Climate Watch and the World Resources Institute.,

The overall picture you see from this diagram is that almost three-quarters of emissions come from energy use; almost one-fifth from agriculture and land use  [this increases to one-quarter when we consider the food system as a whole – including processing, packaging, transport and retail]; and the remaining 8% from industry and waste.

To know what’s included in each sector category, I provide a short description of each. These descriptions are based on explanations provided in the IPCC’s Fifth Assessment Report AR5) and a methodology paper published by the World Resources Institute.,

HUNDREDS OF ALL-TIME LOW TEMPERATURE RECORDS TUMBLED OVER THE PAST 24HRS — MSM SILENT

by Cap Allon, Sep 20, 2020 in Electroverse


A nation-spanning mass of Arctic air has parked itself over the eastern half of North America of late, rewriting the record-books in many states, districts, and provinces, including in New York, Washington, and Ontario.

The city of Syracuse, NY tied an all-time record low of 34F (1.1C) on Saturday morning, just after 6AM, a feat originally achieved back in 1943–duringsolar minimum of cycle 17.

Buffalo also tied a low temperature record — the 38F (3.3C) registered on Saturday matched the record low for the day set back in 1995–solar minimum of cycle 22.


Scientists: No Correlation Between Climate Change And Wildfires In California – Or Anywhere Else On Earth

by K. Richard, Sep 17,2020 in NoTricksZone


A “potential connection” between anthropogenic global warming and the frequency or intensity of wildfires in California has yet to emerge in the trend observations.

Scientists have found a “lack of correlation between late summer/autumn wildfires” and “summer precipitation or temperature” in coastal California. In fact, “there is no long-term trend in the number of fires over coastal California” in the last 50 years (Mass and Ovens, 2019).

mage Source: Marlon et al., 2012

As CO2 concentrations have risen from 300 ppm to 400 ppm (1900 to 2007), the decline in global burned area has been significant (Yang et al., 2014)

Two New Temperature Records Show No Warming In Central Asia Since 1766 A.D. Or In Spain Since 1350 A.D.

by K. Richard, Sep 10, 2020 in NoTricksZone


Scientists continue to publish papers revealing no unusual climate trends for the last several centuries in many regions of the world.

Despite the 135 ppm increase in CO2 concentration (275 ppm to 410 ppm) since the 1700s, a new 250-year temperature (precipitation) reconstruction (Peng et al., 2020) shows there has been no net warming in Central Asia since 1766. Two other reconstructions from this region also show no warming trend in recent centuries.

Earlier this year we highlighted a new study that indicated France was up to 7°C warmer than today about 7800 years ago after cooling by 3°C in the last 200 years.

Another new study (Esper et al., 2020) suggests there has been no net warming in Spain since 1350 A.D.

The years that spanned 1474-1606 A.D. scored 7 of the 10 warmest years in the record. In contrast, there has been only 1 warmest year (1961) and 4 of the 10 coldest years since 1880.

The 2 warmest 30-year (climate) periods occurred in the decades surrounding the ~1530s and ~1820s.

Solar Cycle 25 is here, says NASA

by Oldbrew, Sep 17 , 2020 in  Tallbloke’s Talkshop


Solar Cycle 25 has begun, according to this NASA press release.

During a media event on Tuesday, experts from NASA and the National Oceanic and Atmospheric Administration (NOAA) discussed their analysis and predictions about the new solar cycle – and how the coming upswing in space weather will impact our lives and technology on Earth, as well as astronauts in space.

The Solar Cycle 25 Prediction Panel, an international group of experts co-sponsored by NASA and NOAA, announced that solar minimum occurred in December 2019, marking the start of a new solar cycle.

Because our Sun is so variable, it can take months after the fact to declare this event.

FIRE

by J. Curry, Sep 15, 2020 in WUWT


Subtitle: our failure to live in harmony with nature.

I’m taking a breather today from nonstop hurricane stuff. Well, ‘breather’ may not be quite the right word.

As I’m writing this, I’m looking out into the smoke from the California fires that are blowing into Reno (not to mention much of the rest of the U.S.).  Schools in Reno are supposed to be open (they have a good COVID protocol), but have been closed more than half the time for the past month owing to bad air quality from the fires.

The mantra from global warming activists that manmade global warming is causing the fires, and therefore fossil fuels must be eliminated,  is rather tiresome, not to mention misses the most important factors.  More importantly, even if global warming is having some fractional impact on the wildfires, reducing fossil fuels would fractionally impact the fires but only a time scale of many decades hence.

Climate Scientists Admit Clouds are Still a Big Unknown

by E. Worrall, Sep 12, 2020 in WUWT


The authors assert that if we had a better understanding clouds, the spread of model predictions could be reduced. But there is some controversy about how badly cloud errors affect model predictions, and that controversy is not just limited to climate alarmists.

Pat Frank, who produced the diagram at the top of the page in his paper “Propagation of Error and the Reliability of Global Air Temperature Projections“, argues that climate models are unphysical and utterly unreliable, because they contain known model cloud physics errors so large the impact of the errors dwarfs the effect of rising CO2. My understanding is Pat believes large climate model physics errors have been hidden away via a dubious tuning process, which adds even more errors to coerce climate models into matching past temperature observations, without fixing the original errors.

Climate skeptic Dr. Roy Spencer disagrees with Pat Frank; Dr. Spencer suggests the cloud error biases hilighted by Pat Frank are cancelled out by other biases, resulting in a stable top of atmosphere radiative balance. Dr. Spencer makes it clear that he also does not trust climate model projections, though for different reasons to Pat Frank.

Other climate scientists like the authors of the study above, Paulo Ceppi and Ric Williams, pop up from time to time and suggest that clouds are a significant problem, though Paulo and Ric’s estimate of the scale of the problem appears to be well short of Pat Frank’s estimate.

Whoever is right, I think what is abundantly clear is the science is far from settled.