Archives de catégorie : climate-debate

The Climate Decade that Was: Failed Predictions, Tour De Paris, and the Gretas

by  V. Jayaraj, January 8, 2020 in WUWT


As we step into a new decade, here’s a look at the climate drama that just ended.

The 2010s were dominated by the failure of doomsday prophecies, the adoption of a fantasy climate agreement, unexpected weather trends, and the beginning of the climate emergency cult movement that reminded many of the overpopulation hype of the 1970s and 1980s.
Al Gore Prophecies

Al Gore’s legacy of lies continued to spill into the second decade of this century. Contrary to his predictions in the famous climate documentary An Inconvenient Truth, polar bear populations increased, the Arctic and Antarctic remained relatively unaffected, and no major coastal economy was threatened by rising sea levels.

Gore would have had nightmares when the Canadian authorities in 2019 pondered culling polar bears because of their excess numbers caused trouble for residents in Nunavut.


Continuer la lecture de The Climate Decade that Was: Failed Predictions, Tour De Paris, and the Gretas

Climate Change, Lies And The Lancet

by P. Homewood, January 7, 2020 in ClimateChangeDispatch


The Lancet has published its latest annual report on health and climate change, which inevitably orders us to stop using fossil fuels or the kids will get it!

It is the usual load of overhyped rubbish of the sort we have seen in previous years.

The executive summary contains a number of questionable claims and statements which seriously undermine the report’s integrity and reliability.

For a start, it claims that ‘a child born today will experience a world that is more than four degrees warmer than the pre-industrial average.’

Really? A temperature rise of three degrees in 50 years or so? Even the highly discredited climate models don’t regard this as realistic. For the Lancet to state this as a bald-faced fact calls into question the objectivity of its contents.

It then proceeds to list all sorts of ways in which health is already being impacted by climate change, including disease transmission, air pollution, extreme weather (which apparently will affect women more – yes, that’s got me and all!), wildfires, heatwaves and goodness knows what else.

Yet, tucked away in Figure 5 is the dirty little secret that mortality rates from climate-related causes have been plummeting since 1990.

Greenland Ice Core CO2 Concentrations Deserve Reconsideration

by Renee Hannon, January 7, 2020, in WUWT


Introduction
Ice cores datasets are important tools when reconstructing Earth’s paleoclimate. Antarctic ice core data are routinely used as proxies for past CO2 concentrations. This is because twenty years ago scientists theorized Greenland ice core CO2 data was unreliable since CO2trapped in air bubbles had potentially been altered by in-situ chemical reactions. As a result, Greenland CO2 datasets are not used in scientific studies to understand Northern and Southern hemispheres interactions and sensitivity of greenhouse gases under various climatic conditions.

This theory was put forward because Greenland CO2 data were more variable and different than Antarctic CO2 measurements located in the opposite polar region about 11,000 miles away. This article re-examines Greenland ice cores to see if they do indeed contain useful CO2 data. The theory of in-situ chemical reactions to explain a surplus and deficit of CO2, relative to Antarctic data, will be shown to be tenuous. The Greenland CO2 data demonstrates a response to the Medieval Warm Period, Little Ice Age, Dansgaard-Oeschger and other past climate change events. This response to past climate changes offers an improved explanation for why Greenland and Antarctic CO2 measurements differ. Further, Greenland CO2 measurements show rapid increases of 100 ppm during warm events in relatively short periods of time.

Atmospheric CO2 is More Variable in Northern Latitudes

Figure 1, from NOAA, shows atmospheric CO2 concentrations measured from the continuous monitoring program at four key baseline stations spanning from the South Pole to Barrow, Alaska. CO2 has risen from about 330 ppm to over 400 ppm since 1975 and is increasing at approximately 1-2+ ppm/year. Many scientists believe that rapidly increasing CO2 is mostly due to fossil fuel emissions.

Figure 1. Atmospheric CO2 concentrations from NOAA

Climate models continue to project too much warming

by Dr. J. Lehr & J. Taylor, January 6, 2020 in CFACT


A recently published paper, titled “Evaluating the Performance of Past Climate Model Projections,” mistakenly claims climate models have been remarkably accurate predicting future temperatures. The paper is receiving substantial media attention, but we urge caution before blindly accepting the paper’s assertions.

As an initial matter, the authors of the paper are climate modelers. Climate modelers have a vested self-interest in convincing people that climate modeling is accurate and worthy of continued government funding. The fact that the authors are climate modelers does not by itself invalidate the paper’s conclusions, but it should signal a need for careful scrutiny of the authors’ claims.

Co-author Gavin Schmidt has been one of the most prominent and outspoken persons asserting humans are creating a climate crisis and that immediate government action is needed to combat it. Again, Schmidt’s climate activism does not by itself invalidate the paper’s conclusions, but it should signal a need for careful scrutiny of the authors’ claims.

The paper examines predictions made by 17 climate models dating back to 1970. The paper asserts 14 of the 17 were remarkably accurate, with only three having predicted too much warming.

One of the paper’s key assertions is that global emissions have risen more slowly than commonly forecast, which the authors claim explains why temperatures are running colder than the models predicted. The authors compensate for this by adjusting the predicted model temperatures downward to reflect fewer-than-expected emissions. Yet fewer-than-expected greenhouse gas emissions undercut the climate crisis narrative.

The U.N. Intergovernmental Panel on Climate Change has already reduced its initial projection of 0.3 degrees Celsius of warming per decade to merely 0.2 degrees Celsius per decade. Keeping in mind that skeptics have typically predicted approximately 0.1 degree Celsius of warming per decade, the United Nations has conceded skeptics have been at least as close to the truth with their projections as the United Nations. Moreover, global temperatures are likely only rising at a pace of 0.13 degrees Celsius per decade, which is even closer to skeptic predictions.

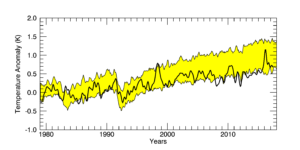
Even after the authors adjusted the model predictions to reflect fewer-than-expected greenhouse gas emissions, there remains at least one very important problem, which immediately jumped out at us when carefully examining the paper’s findings: The paper’s assertion of remarkable model accuracy rests on a substantial temperature spike from 2015 through 2017. A strong, temporary El Niño caused the short-term spike in global temperatures from 2015 to 2017. The plotted temperature data in the paper, however, show that temperatures prior to the El Niño spike ran consistently colder than the models’ adjusted predicted temperatures. When the El Niño recedes, as they always do, temperatures will almost certainly resume running colder than the models predicted, even after adjusting for fewer-than-expected greenhouse gas emissions.

Another problem with the paper is that it utilizes controversial and dubiously adjusted temperature datasets rather than more reliable ones. The paper relies on temperature datasets that are not replicated in any real-world temperature measurements. Surface temperature measurements and measurements taken by highly precise satellite instruments show significantly less warming than the authors claim. The authors rely on temperature datasets that utilize controversial adjustments to claim more recent warming than what has actually been measured, which further undercuts their claim of remarkable model accuracy.

Contrary to what has been written in many breathless media reports, the most important takeaways from the paper are that greenhouse gas emissions are rising at a more modest pace than predicted, the modest pace of global temperature rise reflects the modest pace of rising emissions, and climate models have consistently predicted too much warming—even after accounting for fewer-than-expected greenhouse gas emissions. A temporary spike in global temperatures reflecting the recent El Niño does not save the models from their consistent inaccuracy.

The Evidence Proves That CO2 is Not a Greenhouse Gas

by Tim Ball, September 13, 2018 in Technocracy.News


The Intergovernmental Panel on Climate Change (IPCC) claim of human-caused global warming (AGW) is built on the assumption that an increase in atmospheric CO2 causes an increase in global temperature. The IPCC claim is what science calls a theory, a hypothesis, or in simple English, a speculation.  Every theory is based on a set of assumptions. The standard scientific method is to challenge the theory by trying to disprove it. Karl Popper wrote about this approach in a 1963 article, Science as Falsification. Douglas Yates said,

“No scientific theory achieves public acceptance until it has been thoroughly discredited.”

Thomas Huxley made a similar observation.

“The improver of natural knowledge absolutely refuses to acknowledge authority, as such. For him, skepticism is the highest of duties; blind faith the one unpardonable sin.”

In other words, all scientists must be skeptics, which makes a mockery out of the charge that those who questioned AGW, were global warming skeptics. Michael Shermer provides a likely explanation for the effectiveness of the charge.

“Scientists are skeptics. It’s unfortunate that the word ‘skeptic’ has taken on other connotations in the culture involving nihilism and cynicism. Really, in its pure and original meaning, it’s just thoughtful inquiry.”

The scientific method was not used with the AGW theory. In fact, the exact opposite occurred, they tried to prove the theory. It is a treadmill guaranteed to make you misread, misrepresent, misuse and selectively choose data and evidence. This is precisely what the IPCC did and continued to do.

Early Holocene Temperature Oscillations Exceed Amplitude of Observed and Projected Warming in Svalbard Lakes

by Van der Bilt et al. , December 3, 2019 in GeophysResLetters


Abstract

Arctic climate is uniquely sensitive to ongoing warming. The feedbacks that drive this amplified response remain insufficiently quantified and misrepresented in model scenarios of future warming. Comparison with paleotemperature reconstructions from past warm intervals can help close this gap. The Early Holocene (11.7–8.2 ka BP) is an important target because Arctic temperatures were warmer than today. This study presents centennially resolved summer temperature reconstructions from three Svalbard lakes. We show that Early Holocene temperatures fluctuated between the coldest and warmest extremes of the past 12 ka, exceeding the range of instrumental observations and future projections. Peak warmth occurred ~10 ka BP, with temperatures 7 °C warmer than today due to high radiative forcing and intensified inflow of warm Atlantic waters. Between 9.5 and 8 ka BP, temperatures dropped in response to freshwater fluxes from melting ice. Facing similar mechanisms, our findings may provide insight into the near‐future response of Arctic climate.

It has been hotter, fires have burnt larger areas

by J. Marohasy, January 4, 2020 in WUWT


Last summer, and this summer, has been hot in Australia. But the summer of 1938-1939 was probably hotter — and back then more ferocious bushfires burnt larger areas. In rural Victoria, the summer of 1938-1939 was on average at least two degrees hotter than anything measured with equivalent equipment since, as shown in Figure 1.

Figure 1. Mean maximum summer (December, January February) temperatures as measured at Rutherglen in rural Victoria by The Australian Bureau of Meteorology for the period when mercury thermometers were used. Data unadjusted/not homogenised.

The summer of 1938-1939 was probably the hottest ever in recorded history for the states of New South Wales and Victoria. It is difficult to know for sure because the Bureau has since changed how temperatures are measured at many locations and has not provided any indication of how current electronic probes are recording relative to the earlier mercury thermometers.

Further, since 2011, the Bureau is not averaging measurements from these probes so the hottest recorded daily temperature is now a one-second spot reading from an electronic devise with a sheath of unknown thickness. In the United States similar equipment is used and the readings are averaged over five (5) minutes and then the measurement recorded.


See also: Australia Drought, The Indian Ocean Dipole & Sudden Stratospheric Warming

See also: Australia Bushfires – Is Blaming Greens a Conspiracy Theory?

See also : 24 People Charged For Setting Fires In New South Wales; Arrest Toll Hits 183

See also  : RISING LIKE A PHOENIX — AUSTRALIA’S FORESTS RENEW THEMSELVES

2004 Climate Apocalypse Prediction Bites the Dust

by David Middleton, January 3, 2020 in WUWT


Nolte: Department of Defense Predicted Climate Change Would Destroy Us by 2020

by JOHN NOLTE 3 Jan 2020

Back in 2004, the Department of Defense released a report assuring the world Climate Change would destroy all of us by the year 2020.

Well, welcome to the year 2020! And welcome to yet another fake doomsday prediction number 42 from our renowned climate experts!

Yep, our so-called “climate experts” are now 0-42 with their doomsday predictions, and this latest one is a doozy.

[…]


Australian Wildfire Latest

by P. Homewood, January 3, 2020 in NotaLotofPeopleKnowThat


According to the Telegraph, the current fires have affected 5.9m hectares, or 59,000 km2. While they claim this is three times the size of Wales, we need to remember that Australia is more than 30 times the size of the UK. 59,000 km2 represents 0.77% of Australia’s area, which in UK terms would be about 1800 km2, equivalent to three times the size of the New Forest.

.

Now we can look at the rainfall data for Australia as a whole from BOM:

Certainly the area either side of the Queensland border shows the lowest rainfall on record, but most of the state has seen periods before with lower rainfall.

Also note that worst fires seem to be clustered towards the Victoria border, where rainfall deficiency has been less severe.

Finally it is worth revisiting the rainfall trend map. It shows that since 1900, most of the country has been getting wetter, with the exception of a small part of Queensland, and some coastal areas of Western Australia and southern Australia along with Tasmania:

Also: Let’s tell the burning truth about bushfires and the ALP-Greens coalition

Also : How Greens Made Australia’s Bushfires Worse

Also: Bushfire scientist David Packham warns of huge blaze threat, urges increase in fuel reduction burns

Also : Australia’s Epic Fires Caused By Bad Forestry And Arson, Not Climate Change

Also : Australian wildfires were caused by humans, not climate change

Also : Australian Bushfires Much Worse In 1974/5

Also : Climatologist: Blaming Aussie Bushfires On Climate Change Is ‘Alarmist Nonsense’

Also : Who Checks The Factcheckers?

Also : Fake News: “The idea that “greenies” … would oppose measures to prevent fires … is simply false.”

Also : Forgotten Fact: 1974/75 Australian Bush Fires Were More Than 9 Times Greater Than Those Of 2019/20!

Also : The Aussie Wildfires Are About Arsonists – Not Climate Change

Also : Climate change: Australia fires will be ‘normal’ in warmer world–Matt McGrath

Also : Australia fires: Aboriginal planners say the bush ‘needs to burn’

Also : Fight fire with fire: controlled burning could have protected Australia

Also : Regional Forest Manager: Politicians are Using Climate Change to Deflect Blame for Bushfires

Also Fight Fires With Facts – Not Fake Science

Des observations satellitaires qui ne confirment pas les modèles climatiques

by Jean N., 3 janvier 2020 in ScienceClimatEnergie


3. Conclusions

• Depuis plus de 40 ans que des mesures de température sont effectuées par satellite, la basse et la moyenne troposphère se réchauffent bel et bien. Mais sans aucune accélération visible, et ce à des vitesses de l’ordre de +0.13°C/décade et +0.09°C/décade. La vitesse de réchauffement décroit donc avec l’altitude.

• La zone correspondant à la tropopause (vers 10 km d’altitude) ne se réchauffe pas, contrairement à ce que les modèles informatiques prédisent (pour plus de détails voir les articles de J. Christy). Peut-on alors continuer à utiliser ces modèles pour prédire la température de certaines couches atmosphériques dans le futur? Notons ici que les observations satellitaires sont confirmées par des observations réalisées in situ avec des ballons-sondes.

• La basse stratosphère se refroidit actuellement à la vitesse d’environ –0.29°C par décade, et l’analyse de corrélation menée par Varotsos et Efstathiou nous suggère que le comportement de la stratosphère n’est pas simplement lié à celui de la troposphère, les choses étant plus complexes.

• Les modèles climatiques actuels, basés sur l’hypothèse d’un l’effet de serre radiatif causé essentiellement par du CO2 atmosphérique, sont donc à revoir. Le CO2 (naturel ou d’origine anthropique) pourrait donc n’avoir qu’un rôle mineur et imperceptible sur la température de la troposphère.

En conclusion générale, nous devons toujours garder à l’esprit que le système climatique est très complexe car il est composé de cinq sous-systèmes (atmosphère, cryosphère, hydrosphère, biosphère et lithosphère) et que ces 5 sous-systèmes interagissent les uns avec les autres dans l’espace et le temps avec des processus principalement non linéaires (Lovejoy et Varotsos, 2016) et se comportent de manière chaotique (voir ici). Par conséquent, la modification d’un seul paramètre dans l’un des sous-systèmes (par exemple, la température de la basse troposphère) ne permet pas de prévoir un changement climatique à long terme, car tous les autres paramètres de l’atmosphère mais aussi ceux des autres sous-systèmes (connus et mesurables, ou non) ne sont pas nécessairement connus et stables. En plus de tout cela plusieurs facteurs externes, imparfaitement connus, peuvent influencer chacun des sous-systèmes, comme les rayonnements cosmiques ou les variations du champ magnétique solaire.

An Exceptional Year? Hardly, Mr McCarthy

by P. Homewood, January 1, 2020 in NotaLotofPeopleKnowThat


The year as a whole has been remarkably unremarkable, as far as temperatures are concerned, ranking only the 24th warmest on record since 1659, and not as warm as even 1733, 1779, 1834 and 1868:


https://www.metoffice.gov.uk/hadobs/hadcet/cet_info_mean.html

A closer look at the years since 1980 confirms that the 10-year average has been falling since 2006:

2019 Science Refutes Climate Alarm On Every Front… Shrinking Deserts, Growing Islands, Crumbling Consensus, Weaker Storms, Cooler Arctic Etc. Etc. Etc.

by P. Gosselin, December 31, 2019 in NoTricksZone


2019 science: Absolutely no climate alarm 

No alarm on every aspect: stable polar ice, normal sea level rise, no consensus, growing snow cover, less tropical storms, tornadoes, shrinking deserts, global greening, predictions wrong, models flawed, climate driven by sun, ocean cycles, biodiversity, warmer 1000 years ago…etc…

2019 saw a great amount of new science emerge showing that there’s nothing alarming or catastrophic about our climate. 

Some 2019 scientific findings

Need to make a presentation showing there is no climate alarm? The following findings we reported on in 2019 will put many concerns to rest.

Hundreds of peer-reviewed papers ignored by media

What follows are some selected top science-based posts we published here at NoTricksZone in 2019. These new findings show there is absolutely no climate alarm.

Hundreds of new peer-reviewed papers, charts, findings, etc – which the IPCC, activists and media ignore and even conceal. No wonder they’ve gotten so shrill.

January 2019

….

Scientists Document A DECLINE In Overall Greenhouse Effect Forcing From 1985-2014

by K. Richard, December 30, 2019 in NoTricksZone


CO2 concentrations rose from 345 ppm to 398 ppm in the 29 years from 1985 to 2014. Mainstream scientists sympathetic to the anthropogenic global warming (AGW) paradigm have nonetheless reported the overall greenhouse effect forcing has been flat to declining throughout this period.


1. Cess and Udelhofen, 2003  Due to the downward trend in cloud cover, absorbed shortwave radiation increased and the overall greenhouse effect’s forcing influence declined from 1985-1999. The authors consider these trends to be driven by natural variability.

2. Song et al., 2016The overall greenhouse effect went on “hiatus” from 1992-2014, with the combined forcing effects of water vapor, cloud, and CO2 declining by -0.04 W/m² per year (-0.4 W/m² per decade) during this interval. Again, the main reason for the declining greenhouse effect trend was the downward trend in cloud cover.

3. Kato et al., 2018   Downward longwave radiation (DLR), or the overall greenhouse effect, responds to variability in water vapor and cloud. CO2 isn’t mentioned in the paper as a factor influencing DLR. Total DLR was negative (-0.2 W/m²) during this decade, insinuating rising CO2 had no net warming climate impact. In contrast, downward shortwave forcing increased by +2.2 W/m² per decade from 1986-2000 and by +1.3 W/m² from 2005-2014. These positive shortwave absorption trends explain the warming during this period.

2019: The End Of A Decade When Climate Alarmism Tipped Into ‘Climate Crisis’

by J. Jessop, December 30, 2019 in ClimateChangeDispatch


In the final days of 2019, there is much to reflect upon events of the past year and, with the closing of the second decade of the 21st century, much to reflect upon how climate change alarmism has itself alarmingly morphed into something much more dangerous, visceral, urgent, ideologically driven and immediate as regards public perception and societal impact.

A decade during which global warming faded into obscurity (on account of the fact that there wasn’t any from 1998-2013) to be replaced almost universally by the more politically correct term of ‘climate change’, which has itself now been largely displaced in activist circles and the media by the terms ‘climate emergency’ and ‘climate crisis’.

Ironically so, because, bereft of an actual climate crisis, alarmist scientists and activists have proceeded to invent one, linguistically, as in the case of the Guardian’s newly introduced style guide and by co-opting extreme weather events and their impacts into the general narrative.

Judith Curry has written an excellent push back article to the lukewarm attempt by Wallace-Wells, among others, to dial down the alarmist hype in the light of the RCP8.5 criticisms, whilst still maintaining the necessary ‘scary’ projections of future warming.

DELHI, INDIA SUFFERS ITS SECOND-COLDEST DECEMBER SINCE 1901

by Cap Allon, December 30, 2019 in Electroverse


With fewer than 2 full-days remaining, India’s capital Delhi is about to register its second-coldest month of December since records began in 1901.

According to data from India’s Meteorological Department (IMD), Delhi’s December mean maximum temperature has only-ever dipped below 20C (68F) in 1919, 1929, 1961, 1973 and 1997.

“In December this year, the mean maximum temperature until Thursday [Dec 26] was 19.85C,” said an IMD official. And, given the current forecast, “it is expected to dip to [at least] 19.15C by December 31” — the second-coldest reading after 1973’s mean max temp of 17.3C (63.1F).

Saturday, December 28 saw the season’s lowest daily temperature at the Safdarjung Observatory –Delhi’s official weather station– when a minimum of 2.4C (36.3F) was recorded.

The following day, on Sunday, the IMD issued a “code red” cold warning for Delhi, Haryana, and other neighboring states. Adding to the anomalously cold, dense fog reduced visibility and disrupted air, rail and road traffic.

The Myth of the Apolitical Scientist

by Donna Laframboise, October 28, 2019 in BigPictureNews


Matthew Green is not a naive teenager. He’s a seasoned journalist who has worked in Afghanistan and Pakistan, and who has written a book about a Ugandan warlord. So how do we explain the Reuters story he filed earlier this month, headlined Scientists endorse mass civil disobedience to force climate action?

Its major theme is that there’s something new going on, that the climate situation is so dire scientists have begun behaving in an extraordinary manner. 400 scientists from 20 countries have broken “with the caution traditionally associated” with their profession, he says. Having previously “shunned overt political debate,” they’ve now discovered “a moral duty” to “defy convention.”

In his 1968 bestseller, The Population Bomb, biology professor Paul Ehrlich declaredthat “the time of famines” had arrived. The only “hope for survival” was “drastic worldwide measures.” His book was a political treatise that advocated “brutal and heartless decisions” to solve a problem that never did materialize.

The 1972 bestseller, titled A Blueprint for Survival, similarly proclaimed that “a succession of famines, epidemics, social crises and wars” were inevitable if governments didn’t take specific, dramatic actions. Politicians and the public were urged to pay attention since “34 distinguished biologists, ecologists, doctors and economists” had attached their names to that blueprint.

Steinberger’s comments to the contrary, it has been a long time since we’ve had ‘science as usual.’ Here’s a quote from a book published in 1976:

Blockbuster: Planetary temperature controls CO2 levels — not humans

by JoNova from Murry Salby, December 27, 2019


Over the last two years he has been looking at C12 and C13 ratios and CO2 levels around the world, and has come to the conclusion that man-made emissions have only a small effect on global CO2 levels. It’s not just that man-made emissions don’t control the climate, they don’t even control global CO2 levels.

Continuer la lecture de Blockbuster: Planetary temperature controls CO2 levels — not humans

Failed Serial Doomcasting

by Willis Eschenbach, December 27, 2019 in WUWT


People sometimes ask me why I don’t believe the endless climate/energy use predictions of impending doom and gloom for the year 2050 or 2100. The reason is, neither the climate models nor the energy use models are worth a bucket of warm spit for such predictions. Folks concentrate a lot on the obvious problems with the climate models. But the energy models are just as bad, and the climate models totally depend on the energy models for estimating future emissions. However, consider the following US Energy Information Agency (EIA) predictions of energy use from 2010, quoted from here (emphasis mine):

The only thing that seems clear about all of those questions is that the answer is not “CO2”. Here’s another look at Greenland, this time with CO2 overlaid on the temperature:

Another year, and still no increase in severe U.S. tornadoes

by P. Homewood, December 27, 2019 in WUWT


Climate scientists love to blame every bad weather event on global warming. Yet we never hear them cite climate change for the relative absence of bad weather!

One such example are tornadoes in the US, where we now have several decades of carefully collated data.

With the year near an end, we know that the number of tornadoes has been above average this year, though well below 2008 and 2011. Primarily this is due to several outbreaks in February and April:

https://www.spc.noaa.gov/wcm/#data

Climate change and bushfires — More rain, the same droughts, no trend, no science

by JoNova, December 24, 2019


To Recap: In order to make really Bad Fires we need the big three: Fuel, oxygen, spark.Obviously getting rid of air and lightning is beyond the budget. The only one we can control is fuel. No fuel = no fire.   Big fuel = Fireball apocalypse that we can;t stop even with help from Canada, California, and New Zealand.

The most important weather factor is rain, not an extra 1 degree of warmth. To turn the nation into a proper fireball, we “need” a good drought.  A lack of rain is a triple whammy — it dries out the ground and the fuel — and it makes the weather hotter too. Dry years are hot years in Australia, wet years are cool years. It’s just evaporative cooling for the whole country. The sun has to dry out the soil before it can heat up the air above it.  Simple yes?  El Nino’s mean less rain (in Australia), that’s why they also mean “hot weather”.

So ask a climate scientist the right questions and you’ll find out what the ABC won’t say: That global warming means more rain, not less. Droughts haven’t got worse, and climate models are really, terribly, awfully pathetically bad at predicting rain.

Four reasons carbon emissions are irrelevant

1. Droughts are the same as they ever were.

In the 178 year record, there is no trend. All that CO2 has made no difference at all to the incidence of Australian droughts. Climate scientists have shown droughts have not increased in Australia. Click the link to see Melbourne and Adelaide. Same thing.

3 degrees C?

by J. Curry, December 23, 2019 in ClimateEtc.


Is 3 C warming over the 21st century now the ‘best estimate’?  A reframing of how we think about climate change over the 21st century, and my arguments for 1 C.

There has been much discussion over on twitter of the new article by David Wallace-Wells:  We’re Getting a Clearer Picture of the Climate Future — and It’s n Not as Bad as it Once Looked.  ‘This article is interesting for several reasons, especially since Wallace-Wells has been ‘alarmist in chief.’

Simply put, it is now becoming more widely accepted that RCP8.5 concentration/emissions scenario is highly implausible.  See my previous post:

Are Australian Wildfires Due To Climate Change?

by P. Homewood, December 24, 2019 in NotaLotofPeoppleKnowThat


Many have questioned what role climate change has played in the Australian wildfires currently wreaking havoc in NSW and across the border in Queensland.

The commonly heard cry is that it is now hotter and drier than in the past.

But what does the actual data say?

First, let’s look at rainfall. All the data and graphs  that follows are from the Australian BOM:

In 2020, Climate Science Needs To Hit The Reset Button (Part I)

by R. Pielke JR., December 23, 2019 in ClimateChangeDispatch


In a remarkable essay last week titled, “We’re Getting a Clearer Picture of the Climate Future — and It’s Not as Bad as It Once Looked,” David Wallace-Wells of New York Magazine wrote, “the climate news might be better than you thought. It’s certainly better than I’ve thought.”

The essay was remarkable because Wells, a self-described “alarmist,” is also the author of The Uninhabitable Earth, which describes an apocalyptic vision of the future, dominated by “elements of climate chaos.”

According to Wallace-Wells, his new-found optimism was the result of learning that much discussion of climate change is based on extreme but implausiblescenarios of the future where the world burns massive amounts of coal.

The implausibility of such scenarios is underscored by more recent assessments of global energy system trajectories of the International Energy Agency and United Nations, which suggest that carbon dioxide emissions from the burning of fossil fuels will be relatively flat over the next several decades, even before aggressive climate policies are implemented.

Scenarios of the future have long sat at the center of discussions of climate science, impacts and adaptation and mitigation policies.

Scenario-planning has a long history and can be traced to the RAND Corporation during World War 2 and, later (ironically enough) Shell, a fossil fuel company.

Scenarios are not intended to be forecasts of the future, but rather to serve as an alternative to forecasting. Scenarios provide a description of possible futurescontingent upon various factors, only some of which might be under the control of decision-makers.

8000 Years Of Zero Correlation Between CO2 And Temperature, GISP 2 Ice Core Shows – Opposite Is True!

by P. Gosselin, December 20, 2019 in NoTricksZone


A plot of ice core data from Greenland reveals that CO2 does not drive temperatures.

At Facebook, Gregory Wrightstone posted a chart plotting atmospheric CO2 concentration reconstructed from  Dome C Ice Core versus temperature that was reconstructed from the GISP 2 Ice Core.

According to global warming scientists, there’s supposed to be tandem movement between the two magnitudes.

CO2, they say, drives global temperature.

But over the past 8000 years, the data show that temperature in reality has moved in the opposite direction of CO2 and thus of what climate alarmist scientists have told us.


If anything can be drawn from the plotted data, it is that there’s an inverse correlation: As CO2 rises, temperature drops. But of course there’s a lot more to it. CO2 is not that huge major climate driver that alarmists like having us believe it is.

Recent Scientific Work on Climate

by D. Siegel, December 199, 2019 in MediumWork


In this piece, I’m going to summarize some of the more recent work by scientists and statisticians on climate. It’s important to understand that …