Unearthed new evidence (Mangerud and Svendsen, 2018) reveals that during the Early Holocene, when CO2 concentrations hovered around 260 ppm, “warmth-demanding species” were living in locations 1,000 km farther north of where they exist today in Arctic Svalbard, indicating that summer temperatures must have been about “6°C warmer than at present”.
Proxy evidence from two other new papers suggests Svalbard’s Hinlopen Strait may have reached about 5 – 9°C warmer than 1955-2012 during the Early Holocene (Bartels et al., 2018), and Greenland may have been “4.0 to 7.0 °C warmer than modern [1952-2014]” between 10,000 and 8,000 years ago according to evidence found in rock formations at the bottom of ancient lakes (McFarlin et al., 2018).
In these 3 new papers, none of the scientists connect the “pronounced” and “exceptional” Early Holocene warmth to CO2 concentrations.
Hurricane threat to East Coast due to natural factors
First at his most recent Saturday Summary, the 40-year meteorologist first warns that in-close developing hurricanes of the sort seen in the 1930s are a risk to the US East Coast this year, due the current Atlantic temperature pattern. The reason has nothing to do with CO2 in the atmosphere, but because of natural sea surface temperature cycles.
Sea surface temperatures see “pretty dramatic turnaround”
The Climategate emails expose to our view a world that was previously hidden from virtually everyone.
This formerly hidden world was made up of a very few players. But they controlled those critical Intergovernmental Panel on Climate Change (IPCC) processes involv- ing the temperature records from the past, and the official interpretation of cur- rent temperature data. They exerted previously unrecognized influence on the “peer review” process for papers seeking publication in the officially recognised climate science literature from which the IPCC was supposed to rely exclusively in order to draw its conclusions.
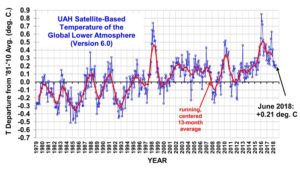
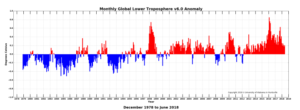
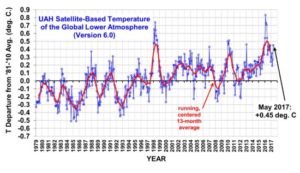
The ‘average’ world temperature for June 2018 was +0.21 deg C above the 1981 – 2010 mean. That represented a decline of about 0.65 deg C from the all-time high of this 39-year record, which was reached in early 2016. The 0.65 deg C decline represented more than 75% of the amount by which the average temperature had exceeded the 1981 – 2010 mean at the highest point. Suddenly the fact that some large number of “all-time highs” was being set at the end of June does not seem very significant.”
by A. Alam Khan, February17, 2018 in GeoScienceFrontiers
Highlights
• Global warming and polar ice-melt not contribute to sea level rise.
• Melting of huge volume of floating sea-ice around polar region cool ocean-water preventing thermal expansion.
• Polar ice melting re-occupy same volume of the displaced water causing no sea level rise.
• Gravitational attraction of the earth plays a dominant role against sea level rise.
• Melting of land ice in the polar region allow crust to rebound elastically for isostatic balancing through uplift should cause sea level to drop relatively.
A University of Aizu team has identified two distinct Indo-Pacific processes shaping the unique features and extraordinary ferocity of super El Ninos. A systematic analysis of these processes and their interactions will improve forecasts of the elusive super El Ninos, the researchers claim.
…
Extremely warm sea surface temperatures are a notable feature of the super El Ninos that occurred in 1972, 1982, and 1997. The fact that Pacific Ocean processes responsible for generating regular El Ninos could not explain this key signature of super El Ninos came as a big shock,” says Dachao Jin, co-author of the study.
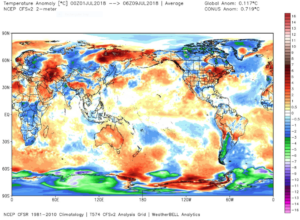
If you were to believe the mainstream media, you’d think our world is burning up. But that is not true.
Yes, there were places on our planet where it was warmer than normal today. But many parts of the world displayed normal or even colder than normal temperatures.
A new German paper assesses wind energy in Europe . The results are devastating. It concludes that wind energy requires almost 100% backup and that the more capacity that gets installed, the greater the volatility.
The paper appearing at the VGB, authored by Thomas Linnemann and Guido Vallana, finds that “the total wind fleet output of 18 European countries extending over several thousand kilometers in north-south and east-west direction is highly volatile and exhibits a strong intermittent character.”
In other words the power supply across the European grid fluctuates wildly and thus cannot work well. The paper’s abstract continues: …
According to the report, if we are to take cooling demand seriously, the key stages to move towards a solution for cooling demand are:
Reducing the energy required for cooling: getting industry to adopt high efficiency cooling technologies and using maintenance to deliver optimum performance.
Reducing the need for cooling through better building design
Systems level thinking across built environment and transport
Considering the strategies and skills required for installing appliances and maintaining them in order to maximise efficiency and reduce energy demand
Creating a model for delivery of affordable cooling to those in rural and urban communities based on the energy needs of local requirements, rather than imposing a ‘one size fits all’ approach
According to the Guardian (9 July 2018), there is a “global heat wave” going on right now.
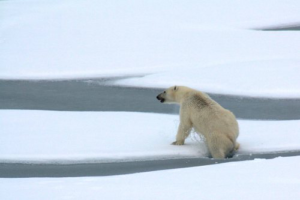
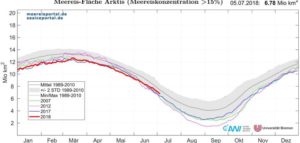
In Siberia, the heat is supposedly “completely unprecedented” and will surely (we are told) impact Arctic sea ice — the habitat of the iconic polar bear. Yet a comparison of previous years shows little to no impact on sea ice: there is more ice present than there was in 2007.
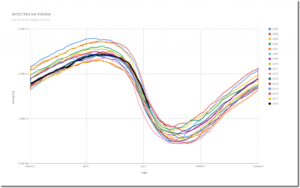
Lately Arctic sea ice volume has been a topic which climate skeptics have been looking at quite closely.
According to Al Gore and a number of climate ambulance chasers, Arctic sea ice in late summer should have long disappeared by now, see here..
But then just a few years after, the Arctic sea ice area began to recover from its lows of 2007 and 2012. So immediately alarmists shouted that area was not really what mattered, but rather sea ice volume is what really counted. Okay, that made perfect sense. Mass is in fact what’s important, and not area, when worrying about polar ice disappearing …
How have we measured the temperature of the ocean’s upper layer in the last 150 years? How does understanding physical processes and observational errors help to standardise climate data and understand climate change?
Sea surface temperature (SST) is also one of the climate indices with the longest histories of direct measurements. Because ocean makes up about 70% of the total Earth’s surface, changes in the temperature of its surface are a key factor for determining the global temperature of the planet’s surface.
Summers in the U.S. are hot. They always have been. Some are hotter than others.
Speaking as a PhD meteorologist with 40 years experience, this week’s heat wave is nothing special.
But judging from the memo released on June 22 by Public Citizen (a $17 million per year liberal/progressive consumer rights advocacy grouporiginally formed by Ralph Nader in 1971 and heavily funded by Leftwing billionaire George Soros’s Open Society Foundations), every heat wave must now be viewed as a reminder of human-caused climate change. The memo opines that (believe it or not) the news media have not been very good about linking weather events to climate change, which is leading to complacency among the public.
With those hot weather records in Los Angeles being set, it’s important to remember where measurements are taken. I’ve done an investigation and found that every “all time high” reported by the LA Times is from a station compromised by heat sources and heat sinks. In my opinion, the data from these stations is worthless.
It’s been going on for some time, for example, back in 2010, because there’s been a questionable high reading reading at USC of 113°F.
To reduce emissions and provide affordable electricity, the world needs to burn more fossil fuels, not less.
That’s the message being delivered by the world’s biggest energy companies at the World Gas Conference in Washington this week, where they championed natural gas as the fuel of the future, rather than one that simply bridges the gap toward renewables. …
German climate and weather analyst “Schneefan” (Snow Fan) here writes a summary of the first half of 2018 thus far. All data show that the surface temperature of the globe has been cooling strongly over the past months and polar ice mass growing.
He writes that in the first half of this year we have seen weak solar activity and La Nina conditions acting to cool the globe’s surface. Moreover Arctic and Antarctic ice mass have grown in comparison to the previous years. …
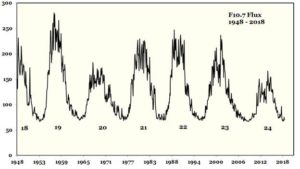
We have only 300 years-odd of detailed solar observations with telescopes, half that of magnetic records, half again in the radio spectrum and less than that for most modern instrument records (and 12 years of Watts Up With That to interpret it). So as the months pass our knowledge of solar activity is still growing appreciably. The evidence points to a major transition of activity in 2006 which has returned us to the solar conditions of the 19thcentury. 19th century-type climate is expected to follow.
From the “I scream, you scream, we all scream for higher temperatures” department. Yesterday, Paul Homewood and I went on a collaborative search to find the weather station at Strathclyde Park which had it’s all-time Scottish high temperature record denied by the Met Office, to no avail. It just wasn’t easily visible. One of Paul’s readers went to the scene and took photos, but it isnit just the photos, it’s what he found out. Photo credits to Duncan McNeil. Read on.
Two solar physicists, Robert Leamon from NASA Goddard Space Flight Center, and Scott McIntosh from the High Altitude Observatory at Boulder, CO, have made an interesting observation that links changes in solar activity with changes in the El Niño Southern Oscillation (ENSO).
As they reported at the AGU 2017 Fall Meeting, the termination of the solar magnetic activity bands at the solar equator that mark the end of the Hale cycle coincides since the 1960’s with a shift from El Niño to La Niña conditions in the Pacific.
Author Mark Sagoff spends 5,000 words discussing a topic that should appall anyone who worries about science being hijacked by politics. The short version is that there’s an international organization “responsible for naming and dating geologic periods, eras, and epochs.” Comprised of geologists, this organization has been under immense pressure to assert that planet Earth is no longer in the geological epoch known the Holocene.
For nearly 20 years, non-geologists such as Nobel-winning atmospheric scientist Paul Crutzen, have been insisting that a new epoch should be officially declared – one that acknowledges humanity’s influence on the planet. They think it should be called the Anthropocene. (In ancient Greek, anthrop means ‘human’.)
A survey of 97 coastal ecosystem experts revealed impacts of climate disturbance but also instances of resilience in all ecosystem types evaluated and at multiple locations worldwide …
The global temperature anomaly for June 2018 changed only slightly from May. Indeed the first six months of 2018 have been steady, varying in a narrow range between +0.26 and +0.18 °C. As noted last month, NOAA’s indication that an El Niño is coming this winter appears on track as we see tropical temperatures continue to inch upward.