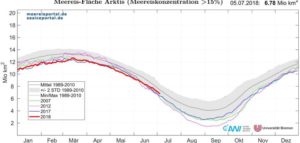
German climate and weather analyst “Schneefan” (Snow Fan) here writes a summary of the first half of 2018 thus far. All data show that the surface temperature of the globe has been cooling strongly over the past months and polar ice mass growing.
He writes that in the first half of this year we have seen weak solar activity and La Nina conditions acting to cool the globe’s surface. Moreover Arctic and Antarctic ice mass have grown in comparison to the previous years. …
We have only 300 years-odd of detailed solar observations with telescopes, half that of magnetic records, half again in the radio spectrum and less than that for most modern instrument records (and 12 years of Watts Up With That to interpret it). So as the months pass our knowledge of solar activity is still growing appreciably. The evidence points to a major transition of activity in 2006 which has returned us to the solar conditions of the 19thcentury. 19th century-type climate is expected to follow.
From the “I scream, you scream, we all scream for higher temperatures” department. Yesterday, Paul Homewood and I went on a collaborative search to find the weather station at Strathclyde Park which had it’s all-time Scottish high temperature record denied by the Met Office, to no avail. It just wasn’t easily visible. One of Paul’s readers went to the scene and took photos, but it isnit just the photos, it’s what he found out. Photo credits to Duncan McNeil. Read on.
Two solar physicists, Robert Leamon from NASA Goddard Space Flight Center, and Scott McIntosh from the High Altitude Observatory at Boulder, CO, have made an interesting observation that links changes in solar activity with changes in the El Niño Southern Oscillation (ENSO).
As they reported at the AGU 2017 Fall Meeting, the termination of the solar magnetic activity bands at the solar equator that mark the end of the Hale cycle coincides since the 1960’s with a shift from El Niño to La Niña conditions in the Pacific.
Author Mark Sagoff spends 5,000 words discussing a topic that should appall anyone who worries about science being hijacked by politics. The short version is that there’s an international organization “responsible for naming and dating geologic periods, eras, and epochs.” Comprised of geologists, this organization has been under immense pressure to assert that planet Earth is no longer in the geological epoch known the Holocene.
For nearly 20 years, non-geologists such as Nobel-winning atmospheric scientist Paul Crutzen, have been insisting that a new epoch should be officially declared – one that acknowledges humanity’s influence on the planet. They think it should be called the Anthropocene. (In ancient Greek, anthrop means ‘human’.)
A survey of 97 coastal ecosystem experts revealed impacts of climate disturbance but also instances of resilience in all ecosystem types evaluated and at multiple locations worldwide …
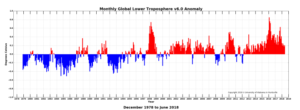
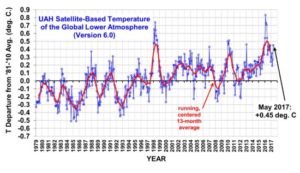
The global temperature anomaly for June 2018 changed only slightly from May. Indeed the first six months of 2018 have been steady, varying in a narrow range between +0.26 and +0.18 °C. As noted last month, NOAA’s indication that an El Niño is coming this winter appears on track as we see tropical temperatures continue to inch upward.
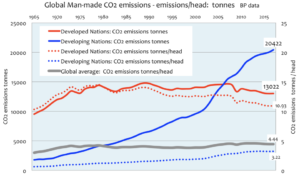
Having been relatively stable for the last 7 years global CO2 emissions grew by ~1.3% in 2017. This growth was in spite of all the international “commitments” arising from the Paris Climate Agreement.
The contrast between the developed and developing worlds remains stark:
developing world emissions overtook Developed world CO2 emissions in 2005 and they have been escalating since.
in terms of their history and the likely prognosis of their CO2 emissions.
Since 1990 CO2 emissions from the developed world have decreased, whereas the developing world has shown a fourfold increase since 1980. CO2 emissions in the developing world are accelerating as the quality of the lives for people in the underdeveloped and developing world improves. At least 1.12 billion people in the developing world still have no access to reliable mains electricity.
Researchers have published 4 new papers this year showing that both tropical cyclone activity and intensity have declined over the past decades. The findings mean atmospheric scientists and policymakers will need to reassess positions on climate change and tropical storms.
Nine years ago the Australian Liberals were on the verge of splitting. Turnbull was about to give the Labor Party a free pass on the Emissions Trading Scheme and sell Australia out to the EU. Climategate broke (thank you FOIA) and the party rebelled and tossed out Turnbull. Now, after three elections where the people voted No to carbon taxes every time they could, we have an emissions trading scheme, a Renewable Energy Target, and one of the most crippling Paris targets of any nation. This is despite our rapidly growing population, huge distances and massive resources and the failure of almost every other nation to even achieve their Paris goals. We are The Global Patsy, obediently sacrificing competitive advantage, GDP, and lifestyle – all so Julie Bishop and Malcolm Turnbull get invited to the right parties. Economic carnage in a glorious quest to make the weather nicer.
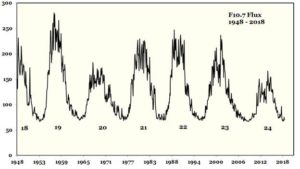
2 July 2018 – “The Belgian department of solar physics research (SIDC) says we are about to touch 100; that is, a hundred days in which we do not see spots on our sun,” says Italian meteorologist Dr Carlo Testa.
During a time of few or no sunspots (a solar minimum) the Sun emits less energy than usual, says Dr Testa. “According to some scholars this situation could lead to climatic upheavals.”
Suffice it to recall, says Testa, that between 1645 and 1715 the most significant solar minimum of history, the Little Ice Age, occurred, bringing years and years marked by very strict winters that lasted until June. (…)
Most of the loudest and most vociferous responses to my last article were predictable. Several topics trigger immediate, irrational, and emotional responses. The mention, or at least the questioning, of Darwin’s Evolutionary Theory, is one of them. All I got was arm-waving and references, but not one piece of empirical evidence to prove the theory. This is the same response you get when you ask for empirical evidence to prove the anthropogenic global warming theory (AGW).
There is another parallel between the two. Many call AGW a hoax, but it is not, partly because a hoax has a humorous component and there is nothing funny about the deception and its impact. A real and very effective scientific hoax involved the obsession with proving Darwin’s theory. It is called the Piltdown Man Hoax after the quarry in which the event occurred. As a traditional hoax, it was designed to prick pomposity, to underscore the weakness of unjustified and arrogant claims, to open eyes closed by obsession. The irony is the victim of the hoax, Charles Dawson, was determined to find the so-called ‘missing link. He sought the empirical fossil evidence that would provide the final link in the evolution of man from apes.
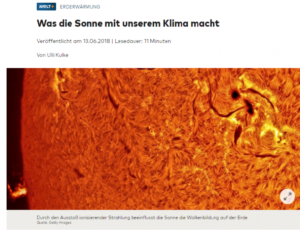
Henrik Svensmark, head of solar research at Denmark’s Technical University in Copenhagen, is one of them. And he ventures far ahead in the climate debate, the research with perhaps the greatest significance of our time. His research is contested, of course. Nevertheless, Svensmark and his critics agree that the topic “sun” deserves more attention in climate research. The participants are particularly interested in the complex interplay between our central star and ionizing emissaries from the depths of the galaxy – “cosmic radiation”.
Svensmark says: “The climate is influenced more by changes in cosmic radiation than by carbon dioxide”. CO2 has an effect, of course, “but it is far less than most current climate models assume, and also less than the influence of cosmic radiation”. In his opinion, a doubling of the greenhouse gas in the atmosphere would cause an increase in global temperature of at most one degree, and not two degrees, as is now generally accepted.
In other words, the “climate sensitivity” of carbon dioxide is only half as high as assumed (…)
There have been articles on WUWT recently, here and here, commemorating the 30 years since James Hansen gave Senate committee testimony about his view of the human influence on climate
(…)
Hansen dramatically emphasized that “The most recent two seasons (Dec.-Jan.-Feb and Mar.-Apr.-May, 1988) are the warmest in the entire record.” This is really a non sequitur. It would be notable if the last point(s) in a long upward-trending series were not the warmest in the series. And, indeed, the 27 seasons preceding the two 1988 record temperatures were all lower than the 1981 seasonal high! (See the next graph, below) Basically, Hansen got lucky again that he had a couple of warm seasons that allowed him to make such a statement to impress the uncritical Senators. Otherwise, he would have had to truncate his graph at 1981 to make a similar claim. He also added an extra season of data to his ‘30-year’ time-series, probably to accentuate the claim. Two seasons sounds more impressive than one season.
In view of the glacial pace of geologic events and the time it takes for things to turn into rock or become encased in it, you might think there would be no hurry to name a new geologic epoch, especially because the current one, the Holocene, started only about 11,500 years ago. You would be wrong. In 2002, Crutzen published an article in Nature magazine, “Geology of Mankind,” which called on geologists “to assign the term ‘Anthropocene’ to the present, in many ways human-dominated, geological epoch, supplementing the Holocene — the warm period of the past 10–12 millennia” and the beginning of which roughly coincided with the advent of human agriculture.The idea of the Anthropocene, which Earth system scientists initiated and advocated, landed like a meteor, setting off a stampede among academics. Nature followed with an editorial that urged that the Anthropocene be added to the geologic timescale. “The first step is to recognize,” Nature editorialized, “that we are in the driver’s seat.”
by M. Bastach, June 28, 2018 in ClimateChangeDispatch
A group of scientists at the University of Rhode Island stumbled on something unexpected when analyzing data brought back from a 2014 expedition to western Antarctica.
Scientists found an abundance of the noble gas Helium-3, indicating there is a volcanic heat source beneath the Pine Island glacier — the fastest melting glacier in the South Pole. The findings were published in a study in the journal Nature Communications.
“When you find helium-3, it’s like a fingerprint for volcanism. We found that it is relatively abundant in the seawater at the Pine Island shelf,” chemical oceanographer Brice Loose, the study’s lead author, said in a statement.
See also here (National Science Foundation) and here
In just the first 6 months of 2018, 254 scientific papers have been published that cast doubt on the position that anthropogenic CO2 emissions function as the climate’s fundamental control knob…or that otherwise serve to question the efficacy of climate models or the related “consensus” positions commonly endorsed by policymakers and mainstream media sources.
SPOTLIGHT: The event in which Jim Hansen put climate change on the media map has triggered hallucinations in high places.
BIG PICTURE: I’ve previously discussed how Timothy Wirth, who chaired an historic US senate committee hearing in 1988, has given two accounts of what happened prior to its commencement.
During a 2007 television interview, he jovially described taking measures to circumvent the air conditioning in the meeting room. Global warming was being discussed, and those in attendance were sweltering. After being challenged by a Washington Post fact checker in 2015, however, Wirth caved. In a written statement, he said the pre-hearing measures didn’t happen. Those were just rumours he’d heard. (…)
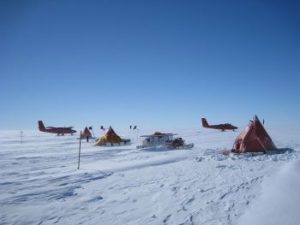
From the AGU and the “but, but, the continent is melting!” department.
COLDEST PLACE ON EARTH IS COLDER THAN SCIENTISTS THOUGHT
WASHINGTON — Tiny valleys near the top of Antarctica’s ice sheet reach temperatures of nearly minus 100 degrees Celsius (minus 148 degrees Fahrenheit) in the winter, a new study finds. The results could change scientists’ understanding of just how low temperatures can get at Earth’s surface, according to the researchers.
Scientists announced in 2013 they had found the lowest temperatures on Earth’s surface: Sensors on several Earth-observing satellites measured temperatures of minus 93 degrees Celsius (minus 135 degrees Fahrenheit) in several spots on the East Antarctic Plateau, a high snowy plateau in central Antarctica that encompasses the South Pole. But the researchers revised that initial study with new data and found the temperatures actually reach minus 98 degrees Celsius (minus 144 degrees Fahrenheit) during the southern polar night, mostly during July and August.
SPOTLIGHT: Competing accounts of an historic climate hearing.
BIG PICTURE: June 23rd, 1988 is considered the day the climate crusade hit the jackpot. Thirty years ago, a sea of television cameras recorded NASA’s James Hansen testifying before a US Senate committee.
The “greenhouse effect has been detected, and it is changing our climate now,” he said. There was “99 percent confidence” that human-caused global warming was underway.
The person chairing the committee was Democratic Senator Timothy Wirth. Nine years later, when interviewed by PBS’s Frontline, he cheerfully revealed that the date of the hearing had been specially chosen.
LM: I found this itemized list rather impressive even though it’s in no way complete. Whether we live in Thailand or Europe, we have been exposed to a very large amount of fearmongering and failed predictions. The explosion of these news in 2005-2010 is easily seen in the lists below. After 2010, the growth arguably stopped or reversed so this contribution may be considered the work by a historian. There’s a clean mobile version of this page.
Dr Peter Ridd has taken James Cook University to court protesting his sacking for what he says is, primarily, speaking-out about the lack of quality assurance in Great Barrier Reef science.
Dr Ridd spoke out initially about there being no quality assurance of Great Barrier Reef science – science that is arguably misused to secure billions of dollars of tax-payer funding. When the University tried to stop Dr Ridd doing this, Dr Ridd spoke out against University management – making all the documentation public including on his new website.
The Arctic and North Atlantic have suddenly turned surprisingly cold. First, according to Weatherbell meteorologist Joe Bastardi, the northern Atlantic has turned cold; so cold in fact that Bastardi called it “impressive”: …
All the Atlantic cold could have a big (positive) impact on the upcoming hurricane season, says hurricane expert Philip Klotzbach. One week ago Klotzbach tweeted …
La géologie, une science plus que passionnante … et diverse