During 2017, there were 150 graphs from 122 scientific papers published in peer-reviewed journals indicating modern temperatures are not unprecedented, unusual, or hockey-stick-shaped — nor do they fall outside the range of natural variability. We are a little over halfway through 2018 and already 108 graphs from 89 scientific papers undermine claims that modern era warming is climatically unusual.
For the sake of brevity, just 13 (15%) of the 89 new papers are displayed below.
The rest of the non-hockey-stick scientific papers and graphs published thus far in 2018 can be viewed by clicking the link below.
The L. A. Times published a Ca. climate alarmist wildfire story falsely claiming that the states most recent wildfires are result of “heat like the state has never seen”.
As usual with climate fear articles like this one in the L. A. Times the scientific reality present a far different picture. The latest scientific study completed by the Royal Society concludes that global wildfires are in decline.
by P. Homewood, August 1, 2018 in NotaLotofPeopleKnowThat
There have been just seven summers over 20c since 1910:
1911
1933
1947
1976
1995
2003
2006
While we don’t know how this summer will work out (and neither does Bob Ward), since 2006 we have had eleven distinctly average summers.
The hot summers above are still rare events, and are all essentially weather events. There is no evidence that these extreme weather events are becoming more frequent.
This post was inspired by Anthony Watts’ recent post about wildfires and their unwillingness to cooperate with the Gorebal Warming narrative.
…
A Geological Perspective of Wildfires
The Fire Window
Geological evidence for ancient wildfires generally consists of sedimentary charcoal deposits (inertinite). Fossil charcoal is also a key factor in understanding the evolution of Earth’s atmosphere, particularly oxygen content. The first clear evidence of fire is in the Late Silurian.
by Tony Heller, July 31, 2018 in ClimateChangeDispatch
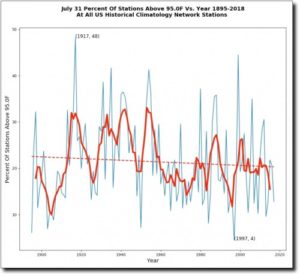
July 31 afternoon temperatures have been declining in the US for a century, with the hottest year being 1917 when almost half of the US was over 95 degrees.
Climatologists trying to predict global warming forgot the sunshine in their sums. After correction of this startling error of physics, global warming will not be 2 to 4.5 K per CO2doubling, as climate models imagine. It will be a small, slow, harmless and net-beneficial 1.17 K.
by Tony Heller, July 30, 2018 in ClimateChangeDispatch
In 1999, NASA’s James Hansen was concerned that the very high-quality US temperature record didn’t match Hansen’s fake global warming trend.
How can the absence of clear climate change in the United States be reconciled with continued reports of record global temperature? Part of the “answer” is that U.S. climate has been following a different course than global climate, at least so far. Figure 1 compares the temperature history in the U.S. and the world for the past 120 years.
in the U.S. there has been little temperature change in the past 50 years, the time of rapidly increasing greenhouse gases — in fact, there was a slight cooling throughout much of the country …
by Cliff Mass, July 25, 2018 in CliffMassWeatherCimateBlog
There appears to be a problem with the temperature sensor at Seattle-Tacoma Airport: it seems to be running several degrees too warm.
This is not the first time this has happened. And excessively warm temperatures at airport stations seems to be a growth industry around here. In a previous blog I talked about the problem at Yakima–which has been fixed. Ellensburg is running too warm as well.
But this blog will be about Seattle-Tacoma Airport, whose official NWS/FAA temperature sensor is located between two of the runways.
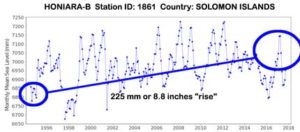
Despite a rapid local sea level rise rate nearly 3 times the global mean (1.8 mm/yr), 15 of 28 studied atoll islands in the southwest Pacific increased in shoreline area during 2005 to 2015 according to a new study (Hisabayashi et al., 2018). For the 3 islands that experienced extreme shoreline erosion – with one atoll island even “disappearing” – a Category 5 cyclone was identified as the most likely causal factor.
Consequently, the authors conclude that “the dramatic impacts of climate change felt on coastlines and people across the Pacific are still anecdotal”.
What’s wrong with comparing Super Storm Sandy’s devastation with projected sea level rise? They are two different things! One is a storm surge, the other an incremental change in either sea level or land subsidence (sinking) or both. For one we can evacuate the immediate area where landfall is forecast to hit in order to save lives. For the other, we have the time to build dikes and barriers like those in England and Holland, or flood-proof, or move. Super Storm Sandy is not unprecedented, and neither are extremely stormy and erratic periods of climate with catastrophic storms, like the Grote Mandrenke — The Great Drowning of Men — of the Little Ice Age. Let me set some perspective.
Journalists should do their job. They should check the most pertinent facts for themselves — in this case: Is sea level really rising 7-10 mm/yr in the Solomons?
Finding out that it hasn’t and isn’t makes a much more interesting story than “yet-another-alarmist-talking-point”.
Do note that while coral atolls are generally self-regenerating, sand spits/sand bars are not — they are at the mercy of the currents and waves.
Encore dans toutes les mémoires, la canicule de 2003 et ses 15 000 morts n’a pas été la plus meurtrière de la France du XXe siècle.
Il faudra marquer cette année 1911 d’une croix noire. » Voilà ce qu’écrivait, à la fin de l’été, un médecin du département de la Seine inférieure. À l’évidence traumatisé par les conséquences de la terrible vague de chaleur qui frappa alors, de juillet à septembre, toute l’Europe mais surtout la France et la Belgique. « Pendant la longue période de chaleur, la mort n’a cessé de faucher les tout-petits élevés au biberon », ajoutera ce médecin.
Une canicule de juillet à septembre
Encore dans toutes les mémoires, la canicule de 2003 et ses 15 000 morts n’a pas été la plus meurtrière en France. C’est ce que rappelait Catherine Rollet dans un article (1) paru en 2010. Cette historienne et démographe, décédée en décembre 2016, y racontait la dramatique canicule de l’été 1911.
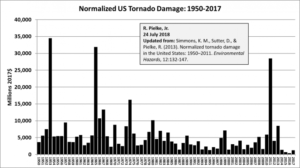
For those that are sure there’s global warming driving tornadoes and other severe weather events, here’s some inconvenient news. Dr. Roger Pielke Jr. has updated his tornado loss data via his Twitter account. He writes:
by Tony Heller, July 25, 2018 in TheDeplorableClimateScienceBlog
In 1972, forty-two “top European and American investigators” predicted a rapidly approaching new ice age – based on an increase in snow and ice cover from 1967-1972.
The technique employed ….. depends on the averaging of information from standard and ‘infra-red satellite weather pictures.
The temperature of the last 100 years was also the topic of a new publication by Folland et al. 2018. The authors are very much at home in the camp of the IPCC and had to admit that there have been phases of cooling, stagnating or even slow warming: 1896 – 1910, 1941 – 1975, and 1998 – 2013.
Climate models struggle with this because CO2 is climbing steadily. So why does climate warming stall under these conditions? Folland and his colleagues examined the models and are convinced that despite the small problems, the models function perfectly well and thus no other climate factors need to be accounted for.
In 1940s it was a bit too warm and the models were unable to reproduce this. Given, the authors say. Greenhouse gases have been responsible for almost all the warming of the last 125 years.
…
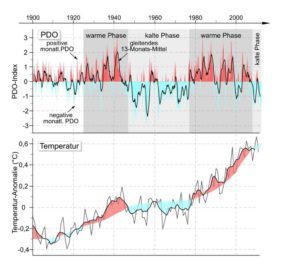
Now isn’t it a bit odd that the authors made absolutely no mention of the ocean cycles in the abstract? As our regular readers know, the ocean cycles run surprisingly synchronous with the fluctuations in global temperatures, i.e. the key factors here are the AMO and PDO.
PDO ocean cycle and its fluctuations in the global temperature development. Source: Book ‘Die kalte Sonne‘.
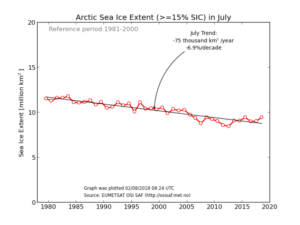
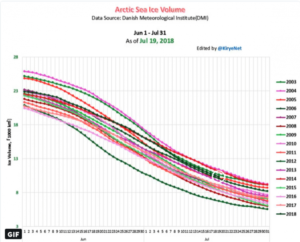
Recently climate catastrophe non-believers have been pointing out that Arctic sea ice volume has been gaining over the past years and has not trended downward for some dozen years now.
And global warming alarmists have been very silent on the subject of climate change now that global surface temperatures have cooled and Arctic and Greenland snow and ice have rebounded.
Embarrassed, they don’t want to be reminded of all the absurd predictions they made 10 years ago, with some as recently as just five years ago.
A new study published in Geophysical Research Journalshows that the so-called Little Ice Age — a period stretching from 1500 to 1850 in which mean temperatures in the northern hemisphere were considerably lower than at present — exerted effects on the climate of South America.
Based on an analysis of speleothems (cave formations) in the Brazilian states of Mato Grosso do Sul and Goiás, the study revealed that in the seventeenth and eighteenth centuries, the climate of southwestern Brazil was wetter than it is now, for example, while that of the country’s Northeast region was drier.
The same Brazilian cave records showed that the climate was drier in Brazil between 900 and 1100, during a period known as the Medieval Climate Anomaly (MCA), when the northern hemisphere’s climate was warmer than it is now.
Sea level has remained virtually at the present level over the last 200 years
In the last 50-70 years sea level has remained perfectly stable in Fiji
This stability is indicated by the growth of corals (stopped to grow vertically, and forced to grow laterally into microatolls) – and corals do not lie
We have (with references at the end)
o Studied your tide gauge records – Mörner & Matlack-Kelin, 2017a
o Studied sites of coastal erosion – Mörner & Matlack-Klein, 2017b
o Documented sea level change during the last 500 years in great details –
Mörner & Matlakc.Kelin, 2917c
o Noted the close similarity to similar records in nations like the Maldives,
Bangladesh and India – Mörner, 2017
o We have presented our data at conferences in Rome (4th WCCC, October 19-21, 2017) and Düsseldorf (11th EIKE, November 9-10, 2017) – see: Clutz, 2017 and Tallbloke’s Talkshop, 2017)
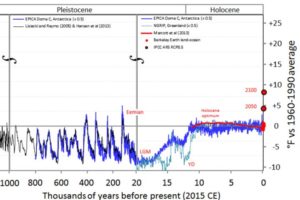
From the University of Helsinki and the “no SUV’s needed” department comes this study which suggests big cold snaps occurred right in the middle of the warm Eemian period. My only concern is perhaps they over-rely on climate models. For reference (and not part of the study) here’s the Eemian graph in context. Data sources listed int he graph.
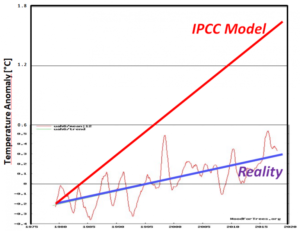
No matter how hard climate-catastrophe obsessed alarmists attempt to beat out a little doom from the data, their results still fall far way short of their projections. Moreover, the modest warming the planet has seen over the recent decades is tied more to natural cycles.
The upcoming 6th IPCC Sixth Assessment Report will be a “comprehensive assessment of the science” related to climate change and published in 2022. However, don’t expect it to be “comprehensive” at all as hundreds of scientific publications showing profound impacts by sun and oceans will go ignored.
Climate science has turned into a religion that centers on a single act of faith. Human CO2 is changing our climate.
In the past it was always understood that climate was impacted by a vast array of factors, such oceanic cycles, solar cycles, aerosols, cloud cover, etc. to name a few.
Remarkably, some Japanese families kept weather record diaries in the 1700 and 1800s, and some for as long as 150 years. The connections they reveal are tantalizing but so incomplete. We are trying to fish out primitive signals from murky water. The Sun turns around on itself every 27 days, so these researchers are looking for repeating patterns in lightning that fit, but the poles of the sun spin slower than the equator and the sun spots can take their own time. Hence, it’s not a neat “27″ days.
During periods of high solar activity, they found regular peaks in lightning activity with the right timing, from May to September when the cold Siberian air mass is not so influential.
Other studies we’ve discussed here have investigated long solar cycles on the 11 year or 200 year scales ….
La géologie, une science plus que passionnante … et diverse