by P. Homewood, April 7, 2018 in NotaLotofPeopleKnowThat
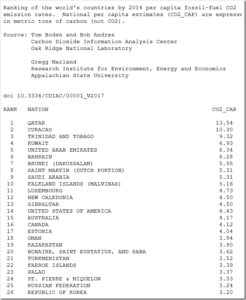
Nick Dekker raised the question of CO2 emissions per capita.
The latest official figures come from the now defunct CDIAC, and are for 2014
(…)
![]()
(…)
by P. Homewood, April 7, 2018 in NotaLotofPeopleKnowThat
Nick Dekker raised the question of CO2 emissions per capita.
The latest official figures come from the now defunct CDIAC, and are for 2014
(…)
![]()
(…)
by Anthony Watts, April 6, 2018 in WUWT
Weather Satellite Wanders Through Time, Space, Causing Stray Warming to Contaminate Data
In the late 1990s, the NOAA-14 weather satellite went wandering through time and space, apparently changing the record of Earth’s climate as it went.
Designed for an orbit synchronized with the sun, NOAA-14’s orbit from pole to pole was supposed to cross the equator at 1:30 p.m. on the sunlit side of the globe and at 1:30 a.m. on the dark side, 14 times each day. One of the instruments it carried was a microwave sounding unit (MSU), which looked down at the world and collected data on temperatures in Earth’s atmosphere and how those temperatures changed through time.
by P. Homewood, April 5, 2018 in NotaLotofPeopleKnowThat
Hadcrut now have numbers out for February, giving an anomaly of 0.523C, measured against the 1961-90 baseline, slightly down on January’s 0.556C.
This means that the last six months have been below 0.59C.
It is clear that temperatures are settling down at a similar level to the period between 2002 and 2007, following the record El Nino of 2015/16. Bear in mind as well that the degree of accuracy, according to the Hadley Centre, is about +/-0.1C. As such, it cannot be said that there has been any statistically measurable warming since 2001, or indeed previously.
It is possible temperatures may drop further in coming months, with weak La Nina conditions established, although these are predicted to disappear by the summer.
by Anthony Watts, April 4, 2018 in WUWT
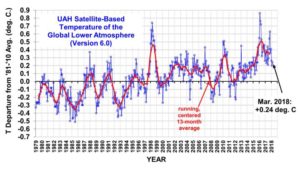
March temperatures (preliminary)
Global composite temp.: +0.24 C (about 0.43 degrees Fahrenheit) above 30-year average for March.
Northern Hemisphere: +0.39 C (about 0.70 degrees Fahrenheit) above 30-year average for March.
Southern Hemisphere: +0.10 C (about 0.18 degrees Fahrenheit) above 30-year average for March.
Tropics: +0.06 C (about 0.11 degrees Fahrenheit) above 30-year average for March.
February temperatures (revised):
Global Composite: +0.20 C above 30-year average
Northern Hemisphere: +0.24 C above 30-year average
Southern Hemisphere: +0.15 C above 30-year average
Tropics: +0.03 C above 30-year average
(All temperature anomalies are based on a 30-year average (1981-2010) for the month reported.)

by P. Gosselin, April 3 , 2018 in NoTricksZone
Despite all the alarmist claims of an Antarctic meltdown, it is well known that the trend for sea ice extent at the South Pole has been one of growing ice rather than shrinking ice over the past 4 decades.
Naturally many factors influence polar sea ice extent, such as weather patterns, winds, ocean currents and sea surface temperature cycles. One factor of course is also surface air temperature, which according to global warming theorists is rising globally (…)
by Ron Clutz, March, 2018 in ScienceMatters
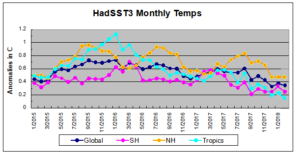
The best context for understanding decadal temperature changes comes from the world’s sea surface temperatures (SST), for several reasons:
- The ocean covers 71% of the globe and drives average temperatures;
- SSTs have a constant water content, (unlike air temperatures), so give a better reading of heat content variations;
- A major El Nino was the dominant climate feature in recent years.
HadSST is generally regarded as the best of the global SST data sets, and so the temperature story here comes from that source, the latest version being HadSST3. More on what distinguishes HadSST3 from other SST products at the end.
by Bjorn Lomborg, April 2, 2018 in ClimateChangeDispatsch
CCD Editor’s Note: In 1920, CO2 levels were 303 PPM or 0.03%. Last year they were 406 PPM or 0.04%. Despite our global population quadrupling, climate deaths have actually gone down as CO2 levels have gone up. Lomborg explains why with the now-standard, often-by-rote “this does not mean that there is no global warming” caveat.
by P. Homewood, April 1, 2018 in NotaLotofPeopleKnowThat
The green shoots of recovery are showing up on satellite images of regions including the Sahel, a semi-desert zone bordering the Sahara to the south that stretches some 2,400 miles (3,860 kilometers).
Images taken between 1982 and 2002 revealed extensive regreening throughout the Sahel, according to a new study in the journal Biogeosciences.
The study suggests huge increases in vegetation in areas including central Chad and western Sudan.
by Anthony Watts, April 1, 2018 in WUWT
Brought to You by SEPP (www.SEPP.org) The Science and Environmental Policy Project
THIS WEEK: By Ken Haapala, President
California Litigation, Monckton: Last week’s TWTW discussed on the public nuisance lawsuits by San Francisco and Oakland against oil companies claiming carbon dioxide (CO2)-caused global warming / climate change will cause harm in the future. It focused on the filing amicus curiae (friend of the court) brief by three distinguished Professors of Physics – William Happer, Steven Koonin and Richard Lindzen (Three Profs). The brief accepted the data and evidence used by the UN Intergovernmental Panel on Climate Change (IPCC) in its Fifth Assessment Report (AR5) and the Climate Science Special Report (CSSR) by the US Global Change Research Program (USGCRP). However, the Three Profs demonstrate the conclusions in the reports are not established, and, at best, premature. They assert:
“Our overview of climate science is framed through four statements
(…)
by Mark Fife, April1, 2018 in WUWT
This is my eighth post in this series where I am examining long term temperature records for the period 1900 to 2011 contained in the Global Historical Climatology Network daily temperature records. I would encourage anyone to start at the first post and go forward. However, this post will serve as a standalone document. In this post I have taken my experience in exploring the history of Australia and applied it forward to cover North America and Europe.
The way to view this study is literally a statistic-based survey of the data. Meaning I have created a statistic to quantify, rank, and categorize the data. My statistic is very straight forward; it is simply the net change in temperature between the first and last 10 years of 1900 through 2011 for each station.
By Tony Heller, April 1, 2018 in TheDeplorableClimSciBlog
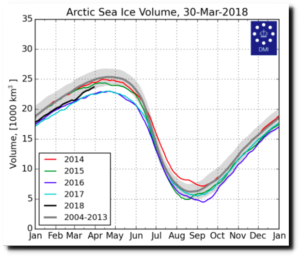
With temperatures of -30C and Arctic sea ice nearing its winter maximum, government climate scientists and their useful idiots in the press announce that Arctic sea ice is “near an all time low.”
In the actual Arctic, sea ice extent is increasing, more than
double six months ago, and essentially identical to all recent years (…)

by P. Homewood, April 1, 2018 in NotaLotofPeopleKnowThat
Lake Chad – a source of water to millions of people in West Africa – has shrunk by nine-tenths due to climate change, population growth and irrigation. But can a scheme dating back to the 1980s save it?
“It’s a ridiculous plan and it will never happen.” That’s the reaction many people have to the idea of trying to fill up Lake Chad and restore it to its former ocean-like glory by diverting water from the Congo river system 2,400km (1,500 miles) away.
by Willy Eschenbach, March 30, 2018 in WUWT
People have asked about the tools that I use to look for any signature of sunspot-related solar variations in climate datasets. They’ve wondered whether these tools are up to the task. What I use are periodograms and Complete Ensemble Empirical Mode Decomposition (CEEMD). Periodograms show how much strength there is at various cycle lengths (periods) in a given signal. CEEMD decomposes a signal into underlying simpler signals.
Now, a lot of folks seem to think that they can determine whether a climate dataset is related to the sunspot cycle simply by looking at a graph. So, here’s a test of that ability. Below is recent sunspot data, along with four datasets A, B, C, and D. The question is, which of the four datasets (if any) is affected by sunspots?
by P. Gosselin, March 30, 2018 in NoTricksZone
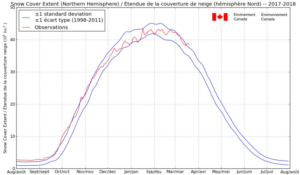
Although a number of scientists are hollering that 2017 was “among the warmest on record”, we are not seeing any manifestation of this, at least over the northern hemisphere, where ironically snow and ice have shown surprising extents. This year the northern hemisphere winter has been surprisingly cold and brutal over a number of regions.
On March 20, 2018, northern hemisphere snow and ice cover was over 1 standard deviation above normal. Source: Environment Canada.
by Cell Press, March 29, 2018 in ScienceDaily
The thousands of metric tons of carbon dioxide (CO2) emitted from power plants each year doesn’t have to go into the atmosphere. Researchers are optimistic that within the next decade we will be able to affordably capture CO2 waste and convert it into useful molecules for feedstock, biofuels, pharmaceuticals, or renewable fuels. On March 29 in the journal Joule, a team of Canadian and US scientists describe their vision for what we should make with CO2 and how we can make it.
by K. Richard, March 29, 2018 in NoTricksZone
Steve McIntyre Spots ‘Several Errors’ Corrupting Arctic 2k; Some Are Corrected In 2014
Steve McIntyre, known for his evisceration of the questionable data-collection processes in the construction of “hockey stick” graphs, identified several suspicious “errors” corrupting the Arctic data set. He wrote about them on his blog.
(…)
by Nic Lewis, March 29, 2018 in ClimateAudit (Steve McIntyre)
The two strongest potentially credible constraints, and conclusions
In Part 1 of this article the nature and validity of emergent constraints[1] on equilibrium climate sensitivity (ECS) in GCMs were discussed, drawing mainly on the analysis and assessment of 19 such constraints in Caldwell et al. (2018),[2] who concluded that only four of them were credible. An extract of the rows of Table 1 of Part 1 detailing those four emergent constraints is given below.[3]
by Renee Hannon, March 28, 2018 in WUWT
In the mid-1900’s many scientists were suggesting the Earth was cooling. Now scientists are forecasting global warming. Indeed, instrumental data shows global temperatures warmed by approximately 1-degree C during the past 165+ years. With warming rates of 0.5 to over 1.3 degrees C per century this has caused considerable alarm for many. This recent warming is commonly attributed to increasing greenhouse gases, primarily CO2.
This post examines natural paleoclimate trends and simple characteristics of past and present climate cycles at different time scales.
by P. Gosselin, March 28,2018 in NoTricksZone
German CO2 equivalent emissions refuse to budge 10 straight years running, despite hundreds of BILLIONS invested in green energies.
As we have been hearing recently, global CO2 emissions continue their steady climb, despite the trillions of dollars committed to green energy sources worldwide and efforts to curb CO2 emissions.
by Anthony Watts, March 27, 2018 in WUWT
A new paper published by NASA by Tsigaridis and Kanakidou suggests that climate models have missed the forcing effects of organic aerosols, such as VOC’s from trees, oceans, and other sources that combine chemically in the atmosphere to create new compounds. Known as Secondary organic aerosols (SOA), they say “SOA forcing could exceed that of sulfate and black carbon”.
by Tony Heller, March 27, 2018 in CimateChangeDispatch
…
The key to understanding this can be found in the 2004 Smithsonian article. The Tuvalu story (like everything else with global warming) has always been about left-wing politics and money, not science.
But not all scientists agree that Tuvalu’s future is underwater. Some critics have branded island leaders as opportunists angling for foreign handouts and special recognition for would-be “environmental refugees” who, they say, are exploiting the crisis to gain entry to New Zealand and Australia. Others have even said that people and organizations sympathetic to Tuvalu are “eco-imperialists” intent on imposing their alarmist environmental views on the rest of the world.
And of course the same fake story in the Maldives, which were supposed to be underwater by 2018.
by D. Wallace-Wells, March 26, 2018 in WUWT
Remember Paris? It was not even two years ago that the celebrated climate accords were signed — defining two degrees of global warming as a must-meet target and rallying all the world’s nations to meet it — and the returns are already dispiritingly grim.
This week, the International Energy Agency announced that carbon emissions grew 1.7 percent in 2017, after an ambiguous couple of years optimists hoped represented a leveling off, or peak; instead, we’re climbing again (…)
by Paul Homewood, March 27, 2018 in NotaLotofPeopleKnowThat
The GWPF has published its State of the Climate 2017 Report, written by Ole Humlum, former Professor of Physical Geography at the University Centre in Svalbard, Norway, and Emeritus Professor of Physical Geography, University of Oslo, Norway.
Here are the main points:
• ……..
••••…..
![]()
by P. Homewood, March 2, 2018 in NotaLotofPeopleKnowThat
Everybody makes mistakes, and some of them matter. On the BBC’s News at Ten on the 18th January 2018 there were two of them, and the GWPF complained a few days later.
The first error was in describing the global temperature of 2017 as the “hottest year on record,” which it wasn’t.
The second mistake was that the BBC’s Environment Analyst Roger Harrabin said that, “2017 had no heating from El Nino,” which was also incorrect.
We pointed out that whilst 2017 was not designated a year in which there was an El Nino event (defined as a period with prolonged El Nino heating) there was in fact El Nino heating in the northern spring for 11 weeks, and we provided a graph to prove it. (Click on image to enlarge)(…)
by Jo Moreau, 25 mars 2018 in Belgotopia
Suite n° 18. (anno 1800-1849)
“Le contenu de la mémoire est fonction de la vitesse de l’oubli”
Désormais, chaque inondation quelque peu catastrophique, chaque tornade, chaque anomalie météorologique est rattachée au réchauffement climatique qui parait-il nous menace, mais dont en plus l’homme serait responsable !
Pourtant, la consultation de chroniques ou récits anciens est révélatrice de précédents tout aussi apocalyptiques, et relativise la notion même de “changements climatiques”, ainsi que la définition d’un “climat stable” qui n’a jamais existé mais qu’on voudrait instaurer à tout prix.