This paper deals with the central argument that skeptics bring up about claims of global warming: How do you separate the temperature signal from the base components like natural variation, human land-use influence, micro-site bias, measurement errors and biases, and other factors to get the “true” global warming signal?
The answer is that you can’t, at least not easily.
With the surface temperature record, it’s somewhat easier since you can observe some of those elements directly and separate them (such as we’ve done in our surfacestations project for land-use microsite biases), but in the ocean, everything is homogenized by the ocean itself. All you can look for is patterns, and try to disentangle based on pattern recognition. That’s what they are trying to do here.
Disentangling Global Warming, Multidecadal Variability, and El Niño in Pacific Temperatures
Authors
Robert C. Wills, Tapio Schneider, John M. Wallace, David S. Battisti, Dennis L. Hartmann
by P. Homewood, March 15, 2015 in NotaLotofPeopleKnowThat
According to the heavily adjusted NOAA data, last month was the fifth warmest February on record in the Central Lakes Division of NY State, with an average mean temperature of 31.4F.
Prior to 1981, the warmest was February 1954, which averaged 29.8F. In other words, NOAA claim that February 1954 was 1.6F colder than last month.
Which all looks very suspicious, because the opposite picture is shown at the high quality station of Ithaca Cornell University (…)
In June 23, 1988 the Senate Committee on Energy and Natural Resources held a hearing addressing the Greenhouse Effect and Global Climate Change.
Among the presenters at this hearing was Dr. James Hansen, Director, NASA Goddard Institute for Space Studies who introduced his infamous and now debunked global surface temperature model results with future temperature projections under three different scenarios of CO2 emissions growth that grossly over exaggerated resulting projected global temperature increases.
Exceptionally large amount of winter snow in Northern Hemisphere this year
The new Arctic Now product developed by the Finnish Meteorological Institute shows with one picture the extent of the area in the Northern Hemisphere currently covered by ice and snow. This kind of information, which shows the accurate state of the Arctic, becomes increasingly important due to climate change. The Arctic region will be discussed at the Arctic Meteorological Week which begins in Levi next week.
German skeptic and weather expert ‘Schneefan’ here writes how climate activist Mark C. Serreze recently announced this year’s sea ice extent was at the smallest all-time area. But since then Arctic temperatures have plummeted and sea ice area has grown to over 14 million square kilometers (…)
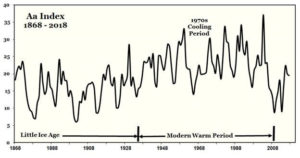
So, you still don’t believe small changes in solar activity can significantly affect climate? You know a very cold period during the Little Ice Age coincided with the Maunder Minimum, but you have heard that the Little Ice Age could have had other causes, like volcanoes. You have been told repeatedly that since 1980 solar activity has been decreasing while global temperature has been increasing, so it can’t be the Sun.
Not so fast. There is a vested interest in climate change not being due to the Sun, as the Sun can’t be taxed or prevented from doing what it does. A further problem is that solar physicists have no clue about how the Sun can show centennial or millennial periodicities. As they prefer to talk about what they know, they reject such periodicities, even though we have evidence in cosmogenic records (14C in tree rings and 10Be in ice cores).
And if I tell you that little changes in the Sun have a disproportionate effect on climate you won’t believe me. You shouldn’t believe me. You shouldn’t believe anybody. Science is not about believing. Religion is about believing. So, I propose that you prove to yourself what effect little changes in the Sun have on climate.
(…) “A recent aerial survey of the Southern Hudson Bay subpopulation concluded that the abundance of polar bears has remained steady since 1986 (943 bears; SE: 174) (Obbard et al., 2015). The survey included the entire coastal range and offshore island habitat of the Southern Hudson Bay subpopulation, except for the eastern James Bay coast. Taken together, the results of the aerial survey and the participant responses from Wemindji and Chisasibi indicate that the local population has remained stable. However, the unanimous responses from participants in Whapmagoostui/Kuujjuarapik suggest that there has been a localized increase in the number of bears near Whapmagoostui/Kuujjuarapik.”
by Dr. B. Peiser, March 12, 2018 in ClimateChangeDispatch
Greens fear that optimism will foster complacency and hence undermine activism. But I find the essays of Pinker and Boisvert inspiring, not enervating.
It is authored by the person whom leading German center-left “intellectual” weekly Die Zeitonce portrayed (black vs white) as the Godfather of the global warming denial and doubt syndicate: Marc Morano of CFACT’s Climate Depot.
This recent post discussed the end of the Modern Warm Period and the year that global cooling began. That post was inspired by a comment to a post on WUWT six to eight years ago to the effect that climate is controlled by the Sun’s magnetic flux – no need to worry about much else. The comment seemed to come from a warmer scientist – they are well funded, have plenty of time on their hands, some are smart and idle curiosity would get a few looking into what controls climate. The results would not be published of course. To paraphrase Mussolini, everything within the narrative, nothing outside the narrative, nothing against the narrative. If the Sun’s magnetic flux controls climate, you don’t have to worry about what goes on under the hood – the effect of EUV on the NAO, the GCR flux, the F10.7 flux, any other flux apart from the magnetic flux (…)
Complémentairement à l’article de Donna Laframboise, il semblerait que les différents groupes de travail du GIEC n’aient pas la même définition d’un conflit d’intérêt. On peut identifier deux formes principales de conflit d’intérêt : soit l’utilisation d’une étude rédigée par un auteur ou coauteur du GIEC, ce qui revient à publier des études qu’on utilisera ensuite dans une auto-justification, (voir aussi à ce sujet un billet précédent : http://belgotopia.blogs.lalibre.be/archive/2013/01/03/methodes-interpellantes-au-sein-du-giec.html ), soit la présence en ses rangs d’un salarié de l’industrie ou d’un membre ou d’un proche d’une ONG militant dans le domaine idéologico-politique.
On se rappelle que des contributeurs du GIEC, salariés de l’industrie chimique, avaient été accusés par diverses sources de conflit d’intérêt en 2016, que dire alors de membres ou proches d’ONG militantes, qui semblent de plus en plus se substituer aux organes démocratiques dans la direction de nos sociétés…
by Douglas Fox, February 16, 2018 in NationalGeographic
Scientists have peered into one of the least-explored swaths of ocean on Earth, a vast region located off the coast of West Antarctica. It is locked beneath a crust of ice larger than Spain and more than 1,000 feet thick, making its waters perpetually dark—and extremely difficult for humans to access. Now, a team of researchers has bored a hole through the ice and sampled the ocean beneath it. Their work could shed light on a poorly understood, but ominous episode in Antarctica’s recent past… (…)
I’m sure you can see the problem with Dr. Judith’s question—temperatures can rise without ANY new sources of heat or ANY change in existing sources of heat.
For example, regarding the climate system, every year there is more and more oil that goes into the ocean. This oil floats on the surface in a monomolecular layer, and it reduces both conduction and evaporation. As a result, the oceans end up slightly warmer than they would be without the oil … where is Dr. Judith’s mysterious “source of heat” supposedly driving that change?
Schellnhuber is often worshipped by the fringe-element climate alarmists as a sort of Climate Pope, whose every uttered word is to be regarded as infallible. Now he may be paying the price for his entrenched, radical positions on climate change.
“We now seriously need a Schellnhuber timeout. […] We do hope the new PIK leadership will correct the extreme direction the institute is currently on and rapidly puts an end to the flow of climate-alarmist press releases.“
BIG PICTURE: In November 1995, the Intergovernmental Panel on Climate Change (IPCC) declared for the first time that humans were changing the climate. Its verdict turned on a single piece of then-unpublished research. Four months after the fact, the research was submitted to a prominent journal. Three months later it was published.
The world then learned that 25% of the IPCC personnel tasked with making its most crucial determination were involved with this research. In a naked a conflict-of-interest, these nine people, led by IPCC chapter head Ben Santer, had evaluated the persuasiveness of their own fledgling scientific work – and had judged it sound enough to change history.
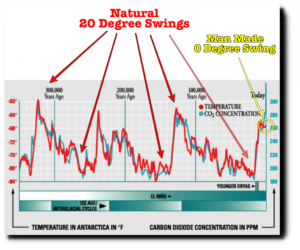
by Tony Heller, March 8, 2018 in TheDeplorableClimateScience
Antarctic ice cores show regular swings in temperature of more than 20 degrees. These were all natural, but the recent zero degree swing was caused by your SUV (…)
A group of prominent scientists are calling for a global network of advanced weather stations that don’t need to go through controversial data adjustments, and it’s vindication for global warming skeptics.
Seventeen climate scientists co-authored a research article published in the International Journal of Climatology calling for a global climate station network modeled after the United States Climate Reference Network (USCRN) to use as a baseline for data quality.
by R.F. Cronin, March 5, 2018 in ClimateChangeDispatch
Actually, the glaciers of Antarctica form in a very different way than Arctic or mountain glaciers. Steam and meltwater feed the glaciers from below. It is the steam from multiple subglacial volcanoes, rifts, and trenches. Antarctica is very seismically active.
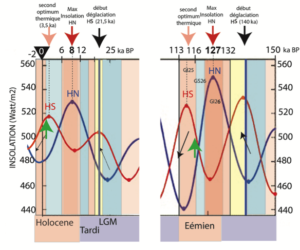
Le forçage climatique principal est l’énergie apportée par le soleil sous la forme primaire de rayonnement visible et UV, l’insolation. Son lieu de stockage principal est l’océan, le thermostat de notre planète. Le gaz le plus abondant à côté de l’azote et de l’oxygène est la vapeur d’eau dont la teneur est éminemment variable dans l’atmosphère (de 0,2 % à 7,6 %). John Tyndall conclut dès 1861 que l’effet de serre est dû essentiellement à cette dernière. Il faut rappeler que le potentiel diffusif thermique induit par la vapeur d’eau est 8 fois supérieur à celui du CO2 à concentration égale (0,04 %). L’immense majorité des articles traitant du changement climatique ne prennent en compte que l’hémisphère nord et l’Antarctique. Or, dans l’hémisphère sud (…)
by Alan Carlin, February 20, 2018 in CarlinEconomicsandScience
Climate alarmists are constantly trying to justify their misguided goal of decreasing emissions of carbon dioxide (CO2), one of the basic molecules that makes possible life on Earth, by making various claims as to the alleged adverse effects of increasing emissions of CO2. To date these claims have either been shown to be false or better explained by natural causes.
by Francis Menton, February 25, 2018 in ManhattanContrarian
Every day you read about the crisis of climate change and fossil fuel usage and CO2 emissions, and commitments from politicians around the world to “act” to “save the planet.” Surely then, CO2 emissions are in steep decline and headed for zero.
The truth is of course the opposite. In the developed world, rapidly increasing use of “renewables” like intermittent wind and solar energy only serves to drive electricity prices through the roof, while having only the most marginal effect on reducing emissions.
Well, seems there’s a surplus of Penguins now, in a place nobody thought to look, there’s an extra 1.5 million Penguins. From Woods Hole Oceanographic Institute.
h/t to WUWT reader Lewis P. Buckingham.
La géologie, une science plus que passionnante … et diverse