by. J. Duhamel, Mar 4, 2024 in ClimateChangeDispatch
I am a geologist which means I have rocks in my head and some of those rocks have recorded the climate history of Earth. Here is their story.
We will start with the big picture.
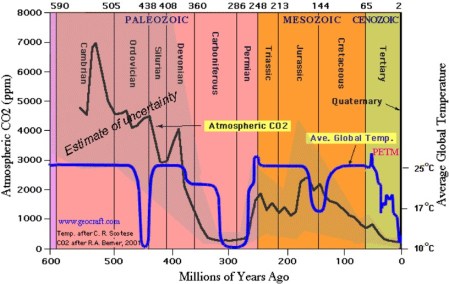
The graphic below [after the jump] shows the estimated temperature and atmospheric carbon dioxide (CO2) content for the past 600 million years. [emphasis, links added]
The blue line is the estimated temperature; the black line is the estimated CO2 content of the atmosphere.
Notice that for much of the past 600 million years, the temperature has been about 12°C warmer than it is now and life has flourished. (Note that the climate crazies claim that if the global temperature increases by 2°C above present, we will die.)
The dips in the temperature curve are ice ages. Ice ages have occurred on a cycle of about 145 million years. Ice ages consist of glacial epochs and warmer interglacial periods. We are now in an interglacial period. (In the popular vernacular, glacial epochs are often called “ice ages.”)
The glacial epoch cycle happens whenever our solar system, in its travels around the center of our galaxy, goes through some spiral arms of the galaxy with very dense clusters of stars that bombard the Earth with more cosmic rays, which produce more clouds and other effects in the atmosphere, which limit the amount sunlight that gets to Earth’s surface.
…

