by F. Menton, Aug 26, 2021 in ManhattanContrarian
The Michael Mann “Hockey Stick” is suddenly back in the news. It’s been so long since we have heard from it, do you even remember what it is?
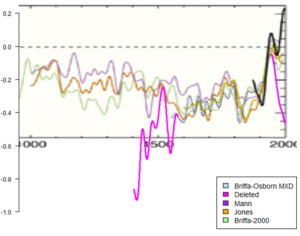
The “Hockey Stick” is the graph that took the world of climate science by storm back in 1998. That’s when Mann and co-authors Raymond Bradley and Malcolm Hughes published in Nature their seminal paper “Global-scale temperature patterns and climate forcing over the past six centuries.” A subsequent 1999 update by the same authors, also in Nature (“Northern Hemisphere Temperatures During the Past Millennium: Inferences, Uncertainties, and Limitations”) extended their reconstructions of “temperature patterns and climate forcing” back another 400 years to about the year 1000. The authors claimed (in the first paragraph of the 1998 article) to “take a new statistical approach to reconstructing global patterns of annual temperature . . . , based on the calibration of multiproxy data networks by the dominant patterns of temperature variability in the instrumental record.” The claimed “new statistical approach,” when applied to a group of temperature “proxies” that included tree ring samples and lake bed sediments, yielded a graph — quickly labeled the “Hockey Stick” — that was the perfect icon to sell global warming fear to the public. The graph showed world temperatures essentially flat or slightly declining for 900+ years (the shaft of the hockey stick), and then shooting up dramatically during the 20th century era of human carbon dioxide emissions (the blade of the stick).
…
…