Archives par mot-clé : Arctic

Newly Discovered Greenland Plume Drives Thermal Activities in the Arctic

by C. Rotter, Dec 29, 2020  in WUWT


A team of researchers understands more about the melting of the Greenland ice sheet. They discovered a flow of hot rocks, known as a mantle plume, rising from the core-mantle boundary beneath central Greenland that melts the ice from below.

The results of their two-part study were published in the Journal of Geophysical Research.

“Knowledge about the Greenland plume will bolster our understanding of volcanic activities in these regions and the problematic issue of global sea-level rising caused by the melting of the Greenland ice sheet,” said Dr. Genti Toyokuni, co-author of the studies.

The North Atlantic region is awash with geothermal activity. Iceland and Jan Mayen contain active volcanoes with their own distinct mantle plumes, whilst Svalbard – a Norwegian archipelago in the Arctic Ocean – is a geothermal area. However, the origin of these activities and their interconnectedness has largely been unexplored.

The research team discovered that the Greenland plume rose from the core-mantle boundary to the mantle transition zone beneath Greenland. The plume also has two branches in the lower mantle that feed into other plumes in the region


Polar bears again attracted to Russian town by dead walrus Attenborough blames on no sea ice

by Polar Bear Science, Dec 20, 2020


In the news again: Cape Schmidt (on the Chukchi Sea) made famous by Sir David Attenborough’s false claim that walrus fell to their deaths because of lack of sea ice due to climate change when a clever polar bear hunting strategy was actually to blame.

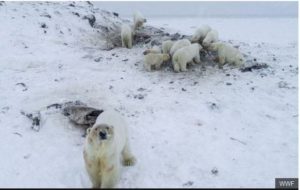
Last year in December (above), some bears were feeding at Ryrkaypiy’s garbage dump and wandering around town after being displaced from feeding on walrus carcasses by bigger, stronger bears on the nearby point.

This year, the town has managed to keep the bears out of town, so while the residents are having no real problems, more than 30 bears have been spotted near town, almost certainly feeding on natural-death carcasses of walrus along the shore (see photo below from 2017 where Ryrkaypiy can be seen in the background).


Newly discovered Greenland plume drives thermal activities in the Arctic

by Tohoku University, Dec 7, 2020 in ScienceDaily


A team of researchers understands more about the melting of the Greenland ice sheet. They discovered a flow of hot rocks, known as a mantle plume, rising from the core-mantle boundary beneath central Greenland that melts the ice from below.

The results of their two-part study were published in the Journal of Geophysical Research.

“Knowledge about the Greenland plume will bolster our understanding of volcanic activities in these regions and the problematic issue of global sea-level rising caused by the melting of the Greenland ice sheet,” said Dr. Genti Toyokuni, co-author of the studies.

The North Atlantic region is awash with geothermal activity. Iceland and Jan Mayen contain active volcanoes with their own distinct mantle plumes, whilst Svalbard — a Norwegian archipelago in the Arctic Ocean — is a geothermal area. However, the origin of these activities and their interconnectedness has largely been unexplored


Claim: The climate changed rapidly alongside sea ice decline in the north

by University of Copenhagen, Dec 6, 2020 in WUWT


Researchers from the Niels Bohr Institute, University of Copenhagen have, in collaboration with Norwegian researchers in the ERC Synergy project, ICE2ICE, shown that abrupt climate change occurred as a result of widespread decrease of sea ice. This scientific breakthrough concludes a long-lasting debate on the mechanisms causing abrupt climate change during the glacial period. It also documents that the cause of the swiftness and extent of sudden climate change must be found in the oceans.

Scientific evidence for abrupt climate change in the past finally achieved

During the last glacial period, app. 10,000 – 110,000 years ago the northern hemisphere was covered in glacial ice and extensive sea ice, covering the Nordic seas. The cold glacial climate was interrupted by periods of fast warmup of up to 16.5 degrees Celsius over the Greenland ice sheet, the so called Dansgaard Oeschger events (D-O).

These rapid glacial climate fluctuations were discovered in the Greenland ice core drillings decades ago, but the cause of them have been hotly contested. D-O events are of particular significance today as the rate of warming seems to be very much like what can be observed in large parts of the Arctic nowadays. The new results show that the abrupt climate change in the past was closely linked to the quick and extensive decline in sea ice cover in the Nordic seas. Very important knowledge as sea ice is presently decreasing each year.

“Our, up until now, most extensive and detailed reconstruction of sea ice documents the importance of the rapid decrease of sea ice cover and the connected feedback mechanisms causing abrupt climate change”, says Henrik Sadatzki, first author of the study.

Sediment core and ice core data were combined in order to achieve the result

Possible 1,000-kilometer-long river running deep below Greenland’s ice sheet

by  Hokkaido University, Nov 12, 2020 in EurekaAlert


Computational models suggest that melting water originating in the deep interior of Greenland could flow the entire length of a subglacial valley and exit at Petermann Fjord, along the northern coast of the island. Updating ice sheet models with this open valley could provide additional insight for future climate change predictions.
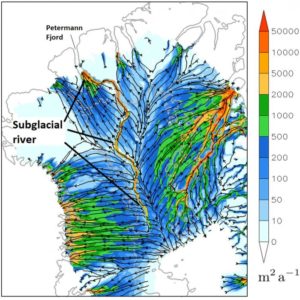
IMAGE: THE SUGGESTED VALLEY AND POSSIBLE RIVER FLOWING FROM THE DEEP INTERIOR OF GREENLAND TO PETERMANN FJORD DEEP BELOW GREENLAND’S ICE SHEET (500 METERS BELOW SEA LEVEL). (CHRISTOPHER CHAMBERS ET AL,… view more 

CREDIT: CHRISTOPHER CHAMBERS ET AL, THE CRYOSPHERE, NOVEMBER 12, 2020.

Radar surveys have previously mapped Greenland’s bedrock buried beneath two to three thousand meters of ice. Mathematical models were used to fill in the gaps in survey data and infer bedrock depths. The surveys revealed the long valley, but suggested it was segmented, preventing water from flowing freely through it. However, the peaks breaking the valley into segments only show up in areas where the mathematical modelling was used to fill in missing data, so could not be real.

Christopher Chambers and Ralf Greve, scientists at Hokkaido University’s Institute of Low Temperature Science, wanted to explore what might happen if the valley is open and melting increases at an area deep in Greenland’s interior known for melting. Collaborating with researchers at the University of Oslo, they ran numerous simulations to compare water dynamics in northern Greenland with and without valley segmentation.

The results, recently published in The Cryosphere, show a dramatic change in how water melting at the base of the ice sheet would flow, if the valley is indeed open. A distinct subglacial watercourse runs all the way from the melting site to Petermann Fjord, which is located more than 1,000 kilometers away on the northern coast of Greenland. The watercourse only appears when valley segmentation is removed; there are no other major changes to the landscape or water dynamics.

“The results are consistent with a long subglacial river,” Chambers says, “but considerable uncertainty remains. For example, we don’t know how much water, if any, is available to flow along the valley, and if it does indeed exit at Petermann Fjord or is refrozen, or escapes the valley, along the way.”

If water is flowing, the model suggests it could traverse the whole length of the valley because the valley is relatively flat, similar to a riverbed. This suggests no parts of the ice sheet form a physical blockade. The simulations also suggested that there was more water flow towards the fjord with a level valley base set at 500 meters below sea level than when set at 100 meters below. In addition, when melting is increased only in the deep interior at a known region of basal melting, the simulated discharge is increased down the entire length of the valley only when the valley is unblocked. This suggests that a quite finely tuned relationship between the valley form and overlying ice can allow a very long down-valley water pathway to develop.

“Additional radar surveys are needed to confirm the simulations are accurate,” says Greve, who has been developing the model used in the study, called Simulation Code for Polythermal Ice Sheets (SICOPOLIS). “This could introduce a fundamentally different hydrological system for the Greenland ice sheet. The correct simulation of such a long subglacial hydrological system could be important for accurate future ice sheet simulations under a changing climate.”

Perhaps the dumbest article title ever: “The Arctic hasn’t been this warm for 3 million years”… AEUHHH???

by D. Middleton, Nov 6, 2020 in WUWT


The sad thing is that this was apparently written by two geoscience professors.


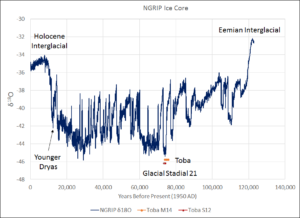
Figure 1. “The oxygen isotopes in the ice imply that climate was stable during the last interglacial period, with temperatures 5 °C warmer than today.” North Greenland Ice Core Project members, 2004

How to Scare and Deceive without Lying: JPL Cries Wolf about Polar Glacial Melt

by C. Beisner, Nov 6, 2020 in WUWT


Yesterday NASA’s Jet Propulsion Laboratory published “The Anatomy of Glacial Ice Loss.” For the most part it’s an interesting, though not particularly revolutionary, discussion of the various forces that add to and subtract from glacial ice. Nothing wrong with that.

But its authors took the opportunity to insert a poison pill, a little bit of fearmongering, in a video caption:

Did you catch that little trick? “Combined, the two regions also contain enough ice, that if it were to melt all at once, would raise sea levels by nearly 215 feet ….”

Well, yes, but at what rate is the ice from the two regions melting, and at what rate can we, with any confidence, predict they’ll continue to melt, and over what period of time?

There is absolutely no chance of their melting “all at once”—barring, I suppose, Earth’s collision with some enormous asteroid that sends Earth careening into the Sun!

So, how fast is the ice melting?

For Greenland, about 0.1% of its ice mass per decade—1 percent per century.

For Antarctica, about 0.0045% per decade—1% in 2,200 years.

Combined, those contribute to sea-level rise of about 1 mm per year, i.e., 3.94 inches per century.

(See “Lying with Statistics: The National Climate Assessment Falsely Hypes Ice Loss in Greenland and Antarctica.”)

So, if the actual rate is about 3.94 inches (0.3283 foot) per century, how long would it take to raise sea level by 215 feet? The answer: 215 ft. / 0.3283 ft. per century = 654.889 centuries, or 65,488.9 years.

3 More New Studies Show Modern Arctic Sea Ice Extent Is Greater Than Nearly Any Time In The Last 10,000 Years

by K. Richard, Oct 29, 2029 in NoTricksZone


For years scientists have been using biomarker evidence (IP25, PIP25) to reconstruct the Arctic’s sea ice history. The evidence shows modern (20th-21st century) Arctic sea ice is at its greatest extent since the Holocene began.

Scientists (Wu et al., 2020) have determined that from about 14,000 to 8,000 years ago, when CO2 lingered near 250 ppm, the Beaufort Sea (Arctic) was “nearly ice free throughout the year” (<0.2 PIP25) and ~4°C warmer than today in winter.

With CO2 at ~400 ppm, this region is 70-100% ice-covered (>0.8 PIP25) for all but 1-2 summer months in the modern (1988-2007) era.

….

“Where’s the sea ice?” Right where it’s been for most of the Holocene.

by D. Middleton, Oct 30, 2020 in WUWT


This is sort of a sequel yesterday’s post: Where’s the sea ice? 3 reasons the Arctic freeze is unseasonably late and why it matters.

What a difference a day can make! Looks like it’s starting to crust over:

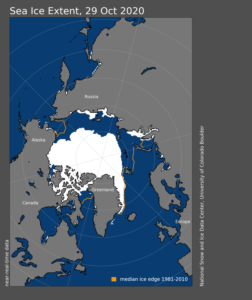
Figure 0. Daily sea ice extent map, October 29, 2020. (NSIDC)

Two key takeaways:

  1. Maximum Holocene sea ice extent occurred within the past 500-1,000 years at every location.
  2. The current sea ice extent is higher at all of the locations than over 50% to 85% of the Holocene.

While this doesn’t tell us what the sea ice extent was in million km2, it does tell us that the modern sea ice extent is larger than it was over most of the Holocene Epoch. It also tells us that the areas of currently seasonal sea ice extent have been seasonal or reduced over most of the past 5,000 years and ice-free or nearly ice-free over the prior 3,000 years or so. Here’s is the Kinnard graph plotted at the same horizontal scale as the Stein cross section:

Guardian Needlessly Alarmed By Late Freeze

by P. Homewood, Oct 27, 2020 in NotaLotofPeopleKnowThat


For the first time since records began, the main nursery of Arctic sea ice in Siberia has yet to start freezing in late October.

The delayed annual freeze in the Laptev Sea has been caused by freakishly protracted warmth in northern Russia and the intrusion of Atlantic waters, say climate scientists who warn of possible knock-on effects across the polar region.

Ocean temperatures in the area recently climbed to more than 5C above average, following a record breaking heatwave and the unusually early decline of last winter’s sea ice.

The trapped heat takes a long time to dissipate into the atmosphere, even at this time of the year when the sun creeps above the horizon for little more than an hour or two each day.

Graphs of sea-ice extent in the Laptev Sea, which usually show a healthy seasonal pulse, appear to have flat-lined. As a result, there is a record amount of open sea in the Arctic.

“The lack of freeze-up so far this fall is unprecedented in the Siberian Arctic region,” said Zachary Labe, a postdoctoral researcher at Colorado State University. He says this is in line with the expected impact of human-driven climate change.

“2020 is another year that is consistent with a rapidly changing Arctic. Without a systematic reduction in greenhouse gases, the likelihood of our first ‘ice-free’ summer will continue to increase by the mid-21st century,’ he wrote in an email to the Guardian.

The warmer air temperature is not the only factor slowing the formation of ice. Climate change is also pushing more balmy Atlantic currents into the Arctic and breaking up the usual stratification between warm deep waters and the cool surface. This also makes it difficult for ice to form.

NSIDC: 2020 POLAR ICE DOING JUST FINE

by Cap Allon, Oct 24, 2020 in Electroverse


According to the latest October report from the National Snow and Ice Data Center (NSIDC), the ice locked at Earth’s poles is, overall, GROWING.

By volume, Antarctica contains 90% of Earth’s ice, and volume is a far better metric to use when judging the state of an ice sheet than sea ice extent. Extent is prone to wild and unpredictable fluctuations due to natural changes in ocean currents and wind patterns, etc–though these fluctuations are of a much lesser degree in Antarctica than in its northern cousin, the Arctic.

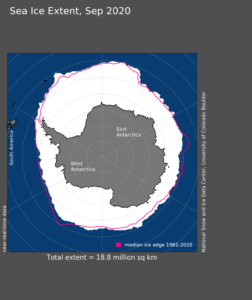
According to the latest NSIDC report, Antarctic sea ice extent reached a whopping 18.95 million square kilometers (7.32 million square miles) on September 28. Mid to late Sept would usually give us the year’s maximum extent, but given the favorable conditions in October, the maximum may well be higher. “As is typical this time of year, there are wide swings caused by winds and storms along the extensive ice edge,” writes the NSIDC.

Ice extent around Antarctica is now “well above the 1981 to 2020 median extent,” the NSIDC informs us. “Ice extent is above the median extent along a broad area off the Wilkes Land coast and western Ross Sea, near the median extent from the Amundsen Sea clockwise to the Weddell Sea and above the median north of Dronning Maud Land, Enderby Land, and the Cosmonaut Sea. The only major area of below the median extent is in the Indian Ocean sector near the Amery Ice Shelf and eastward.”

Continuer la lecture de NSIDC: 2020 POLAR ICE DOING JUST FINE

Claim: Svalbard glaciers lost their protective buffer in the mid-1980s and have been melting ever since

by B. Noel & M.  van den Broeke, Sep  23, 2020 in WUWT/U.Utrecht


The archipelago of Svalbard, a land of ice and polar bears, is found midway between mainland Norway and the North Pole. Its capital Longyearbyen on the main island of Spitsbergen is the world’s most northerly city, some 800 miles inside the Arctic Circle.

Svalbard is also home to some of the Earth’s northernmost glaciers, which bury most of the archipelago’s surface under no less than 200 metres of thick ice. Taken together, Svalbard glaciers represent 6% of the worldwide glacier area outside the large ice sheets of Greenland and Antarctica – if they totally melted, they would raise the sea level by 1.7cm.

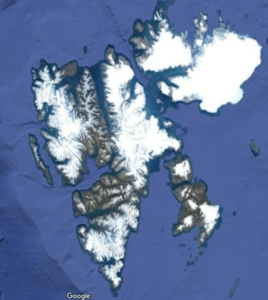
Svalbard is roughly the size of Ireland or Sri Lanka, but largely covered in ice. Google Maps

Claim: Sea level rise from ice sheets track worst-case climate change scenario

by University of Leeds, September 1, 2020 in WUWT/Nature


Ice sheets in Greenland and Antarctica whose melting rates are rapidly increasing have raised the global sea level by 1.8cm since the 1990s, and are matching the Intergovernmental Panel on Climate Change’s worst-case climate warming scenarios.

So far, global sea levels have increased in the most part through a mechanism called thermal expansion, which means that volume of seawater expands as it gets warmer. But in the last five years, ice melt from the ice sheets and mountain glaciers has overtaken global warming as the main cause of rising sea levels.

Dr Ruth Mottram, study co-author and climate researcher at the Danish Meteorological Institute, said: “It is not only Antarctica and Greenland that are causing the water to rise. In recent years, thousands of smaller glaciers have begun to melt or disappear altogether, as we saw with the glacier Ok in Iceland, which was declared “dead” in 2014. This means that melting of ice has now taken over as the main contributor of sea level rise. “

###

Further information

The study, “Ice-sheet losses track high-end sea-level rise projections,” is published today (31 August) in Nature Climate Change.

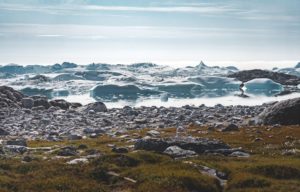
View towards Icefjord in Ilulissat. Easy hiking route to the famous Kangia glacier in Greenland. The Ilulissat Icefjord seen from the viewpoint. Declared a UNESCO World Heritage Site in 2004. Photo taken in Greenland.

Claim: Past evidence supports complete loss of Arctic sea-ice by 2035

by BRITISH ANTARCTIC SURVEY, August 3, 2020 in WUWT/Ch. Rotter


A new study, published this week in the journal Nature Climate Change, supports predictions that the Arctic could be free of sea ice by 2035.

BRITISH ANTARCTIC SURVEY

A new study, published this week in the journal Nature Climate Change, supports predictions that the Arctic could be free of sea ice by 2035.

High temperatures in the Arctic during the last interglacial – the warm period around 127,000 years ago – have puzzled scientists for decades. Now the UK Met Office’s Hadley Centre climate model has enabled an international team of researchers to compare Arctic sea ice conditions during the last interglacial with present day. Their findings are important for improving predictions of future sea ice change.

During spring and early summer, shallow pools of water form on the surface of Arctic sea-ice. These ‘melt ponds’ are important for how much sunlight is absorbed by the ice and how much is reflected back into space. The new Hadley Centre model is the UK’s most advanced physical representation of the Earth’s climate and a critical tool for climate research and incorporates sea-ice and melt ponds.

Using the model to look at Arctic sea ice during the last interglacial, the team concludes that the impact of intense springtime sunshine created many melt ponds, which played a crucial role in sea-ice melt. A simulation of the future using the same model indicates that the Arctic may become sea ice-free by 2035.

Joint lead author Dr Maria Vittoria Guarino, Earth System Modeller at British Antarctic Survey (BAS), says:

“High temperatures in the Arctic have puzzled scientists for decades. …

NASA “CLIMATE PROPHET” JAMES HANSEN SAID THE ARCTIC WOULD BE “FREE OF SUMMER ICE” BY 2018

by Cap Allon, August 2, 2020 in Electroverse


Bolstered by the sycophantic-praise he received following his 1988 Congressional testimony on man-made global warming, NASA climate scientist/activist James Edward Hansen continued his prophesies well into the 2000s–despite his ever-growing list of climate fails.

“The greenhouse effect is here,” pronounced doomsayer Hansen back on June 23, 1988.

“We’re [still] toast,” he repeated with a straight face 20 years later, in 2008.

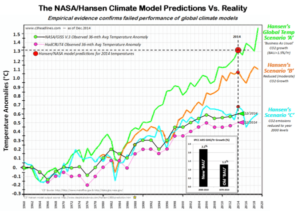
in preparation for his 1988 Congressional testimony, scientists/activist Hansen produced three potential scenarios regarding the future trend for global average temperatures:

A) “Business As Usual” — if human’s did nothing regarding rising CO2 levels.

B) If we “moderately” reduced CO2 emissions.

C) If atmospheric carbon dioxide was reduced to year 2000 levels.


Real-world observations reveal Hansen’s projections were way off. Scenarios A and Bsignificantly over-predict the warming trend. And digging into the data, A overstates CO2 and other greenhouse gas growth and rejects against the observations; Scenario B slightly understates CO2 growth, overstates methane and CFCs and zeroes-out other greenhouse gas growth, and it too significantly overstates the warming.

The scenario that best-matches the observations is C — the one where Hansen has CO2 topping-out at 368 ppm in 2000 but then sees it fixed at that level thereafter–something that obviously didn’t happen. It’s this drastic “halt the industrial revolution” scenario that ended up with a warming trend most like the real-world observations.

Here is one thought, proposed by climate scientist John Christy:

Suppose Hansen had offered a Scenario D, in which greenhouse gases continue to rise, but after the 1990s they have very little effect on the climate. That would play out similarly in his modeled Scenario C, and it would match the data — this hypothetical Scenario D is the reality we’re living today.

James Edward Hansen is still considered a “climate prophet” by many, but his 1988 scenarios simply DO NOT FIT THE DATA–speaking of which, let’s look at his Arctic sea ice predictions.


A snapshot of melting Arctic sea ice during the summer of 2018

by C. Rotter, July 30, 2020 in WUWT


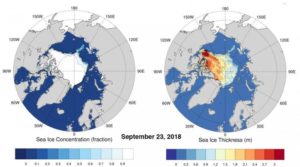
IMAGE: THIS FIGURE SHOWS THE SEA ICE CONCENTRATION AND THICKNESS IN THE ARCTIC ON SEPTEMBER 23RD 2018. view more CREDIT: JUHI YADAV

As sea ice in the Arctic retreats further and melts faster every decade, scientists are racing to understand the vulnerabilities of one of the world’s most remote and unforgiving places. A study appearing July 29 in the journal Heliyon details the changes that occurred in the Arctic in September of 2018, a year when nearly 10 million kilometers of sea ice were lost over the course of the summer. Their findings give an overview at different timescales of how sea ice has receded over the 40 years of the satellite era and show how the summer’s extensive decline is linked to global atmospheric processes as far south as the tropics.

At the peak of its melting season, in July 2018, the Arctic was losing sea ice at a rate of 105,500 square kilometers per day–an area bigger than Iceland or the state of Kentucky. “On the ground, I am sure it would have looked like an excellent summer month in the Arctic, in general, but over the past four decades, September sea-ice loss has accelerated to a rate of 12.8% per decade and 82,300 square kilometers per year,” says co-author Avinash Kumar, a senior scientist at the National Centre for Polar and Ocean Research (NCPOR) in India.

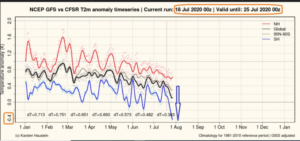
NCEP Analysis: Northern Hemisphere Surface Temperature Falls 1°C Since February

by P. Gosselin, July 18, 2020 in NoTricksZone


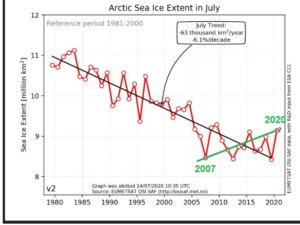
Also the Danish Meteorological Institute (DMI) projects a sturdy Arctic sea ice extent for this July, meaning no falling summer ice extent trend since 2007! The climate alarms are being muffled. 

Snowfan here gives us the latest on global mean temperature and Arctic sea ice.

After the year’s low in June 2020, with an anomaly of +0.48°C from the 1981-2010 WMO climate mean, the global 2-meter temperatures (black line) depicted below shows the July 16, 2020 analysis and forecast up to July 23.

Source: here


Source: DMI

A surprising DMI forecast was issued on July 14, 2020 which projects strong growth of Arctic sea ice areas for July 2020. If this expert forecast is correct, it would mean there’s been a strongly positive summer trend since 2007 – instead of the ridiculous Al Gore complete meltdown.

Arctic Ocean changes driven by sub-Arctic seas

by University of Alaska Fairbank, July 12, 2020 in WUWT


New research explores how lower-latitude oceans drive complex changes in the Arctic Ocean, pushing the region into a new reality distinct from the 20th-century norm.

The University of Alaska Fairbanks and Finnish Meteorological Institute led the international effort, which included researchers from six countries. The first of several related papers was published this month in Frontiers in Marine Science.

Climate change is most pronounced in the Arctic. The Arctic Ocean, which covers less than 3% of the Earth’s surface, appears to be quite sensitive to abnormal conditions in lower-latitude oceans.

“With this in mind, the goal of our research was to illustrate the part of Arctic climate change driven by anomalous [different from the norm] influxes of oceanic water from the Atlantic Ocean and the Pacific Ocean, a process which we refer to as borealization,” said lead author Igor Polyakov, an oceanographer at UAF’s International Arctic Research Center and FMI.

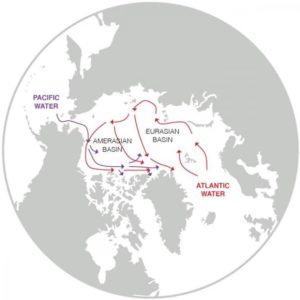
Although the Arctic is often viewed as a single system that is impacted by climate change uniformly, the research stressed that the Arctic’s Amerasian Basin (influenced by Pacific waters) and its Eurasian Basin (influenced by Atlantic waters) tend to differ in their responses to climate change.

Since the first temperature and salinity measurements taken in the late 1800s, scientists have known that cold and relatively fresh water, which is lighter than salty water, floats at the surface of the Arctic Ocean. This fresh layer blocks the warmth of the deeper water from melting sea ice.

IMAGE: A MAP OF THE ARCTIC OCEAN SHOWS THE LOCATION OF THE AMERASIAN AND EURASIAN BASINS. ARROWS SHOW THE PATH OF WARM, FRESH PACIFIC WATER AND WARM, SALTY ATLANTIC WATER INTO… view more CREDIT: GRAPHIC ADAPTED FROM POLYAKOV ET AL. 2020, FRONTIERS IN MARINE SCIENCE PAPER.

10 fallacies about Arctic sea ice & polar bear survival refute misleading ‘facts’

by S. Crockford, July 8, 2020 in WUWT


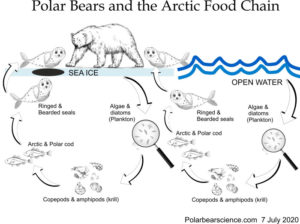
This updated blog post of mine from last year is as pertinent now as it was then: it’s a fully-referenced rebuttal to the misleading ‘facts’ so often presented this time of year to support the notion that polar bears are being harmed due to lack of summer sea ice. Polar Bears International developed ‘Arctic Sea Ice Day’ (15 July) to promote their skewed interpretation of polar bear science at the height of the Arctic melt season. This year I’ve add a ‘Polar Bears and the Arctic Food Chain‘ graphic, which readers are free to download and share. For further information, see “The Polar Bear Catastrophe That Never Happened“.

Remember when we were told: “The Arctic Is On Fire, and We Should all Be Terrified”? It’s SNOWING there now.

by Anthony Watts, July 7, 2020 in WUWT


From the “weather is not climate”, you идиот department comes this about face by climate change nature.

Remember just a couple of weeks ago we were lectured to about the dangers of climate change turning towns around the Arctic circle into easy-bake ovens?

Well, I pointed out how absurd this all was, especially since it also happened 100 years ago, before the climate change was even a glimmer in leftists eyes. And, because with 24 hour sunlight at the peak of the summer solstice, the area is bound to get hot, because there’s no “night” to cool off. Of course, that didn’t stop opportunistic trough-feeding scientists like Mark “the Arctic is screaming” Serreze from taking advantage of the situation, claiming it was all part of a disturbing pattern.

Naturally, the visual that was produced on Twitter to scare people was pretty convincing to the non-thinking media types that pounced on the story.

DESPITE THE LIES, THE SPIN, AND THE PROPAGANDA, ANTARCTIC SEA ICE IS GROWING — BOTH EXTENT AND CONCENTRATION GREATER NOW THAN IN 1980

by Cap Allon, July 6, 2020 in Electroverse


The UN and their scraggly little offshoot, the IPCC, are at it again — obfuscating data in order to push their fraudulent catastrophic global warming agenda.

According to the IPCC, and picked up the usual AGW propaganda rags such as the Guardian: “the South pole is warming three times faster than rest of the world.”

The Guardian articledated June 30, 2020 continues in predictably befogging fashion: “Dramatic change in Antarctica’s interior in past three decades a result of effects from tropical variability working together with increasing greenhouse gases.”

But, 1) the MSM have a habit of claiming everywhere is warming faster than everywhere else:

And 2), the actual data reveals quite the opposite re Antarctica.

As @Harry_Hardrada recently pointed out on Twitter, there was a larger extent and concentration of Antarctic Sea Ice in June 2020 than back in June 1980:

Robert Felix over at iceagenow.com dives into the data, adding that sea ice extent today stands at 700,000 sq km (270,272 sq miles) greater than in 1980.

And in case you’re having a hard time reading the numbers, Felix breaks them down for you:

Sea ice extent in June 2020 = 13.2 million sq km
Sea ice extent in June 1980 = 12.5 million sq km

Sea ice concentration in June 2020 = 10.6 million sq km
Sea ice concentration in June 1980 = 9.6 million sq km

Fact-checked!

That’s enough extra ice to entirely cover Maryland, Delaware, West Virginia, South Carolina, Virginia, Indiana, Ohio and all six New England states. Oh, and throw in Washington, D.C. for good measure. (Which might be a good idea.)

 See also THE ARCTIC IS ON FIRE, AND WE SHOULD ALL BE TERRIFIED” — FACT CHECK: IT’S CURRENTLY SNOWING IN VERKHOYANSK

CLAIM: 100 degrees in Siberia? 5 ways the extreme Arctic heat wave follows a disturbing pattern

by C. Rotter, June 28, 2020 in WUWT


This essay from director of NSIDC, Mark Serreze, is provided for reference. You may remember Serreze who once said “the Arctic is screaming” while botching and then backpedaling on claims of “ice free summers” on the near horizon for the Arctic that never happened. Give it all the consideration it is due. For some perspective, see my article on a previous 100 degree event above the Arctic circle over 100 years ago. By the way, with 24 hours daylight above the Arctic circle, and near 24 hour daylight in Siberia this time of year, (the first day of summer aka  the summer solstice) is it any surprise it would get warm?

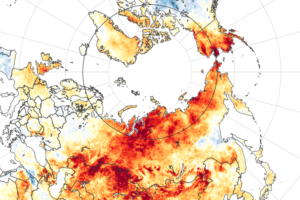
This Arctic heat wave has been unusually long-lived. The darkest reds on this map of the Arctic are areas that were more than 14 degrees Fahrenheit warmer in the spring of 2020 compared to the recent 15-year average. Joshua Stevens/NASA Earth Observatory

Scientists Panic, Because Arctic Is 0.4F Warmer Than In 1915!

by P. Homewood, June 21, 2020 in NotaLotofPeopleKnowThat


The Arctic is thought to have recorded its hottest ever temperature of 100.4F (38C) in Siberia, an astonishing 32F (18C) above the normal level for this time of year.

The mercury shot up to the unprecedented level in Verkhoyansk, 3,000 miles east of Moscow, as the region endures a summer heatwave.

Scientists had predicted the Arctic wouldn’t reach these levels until 2100, meaning it is warming 80 years faster than previously thought.

If the record is confirmed it will represent a new high. The current record for hottest temperature in the Arctic is held by Prospect Creek, Alaska, which recorded 100F (38C) in 1915.

Weatherman for CBS, Jeff Beradelli, said on Twitter yesterday: ‘Likely the hottest temperature ever recorded in the Arctic happened today.

‘What’s happening in Siberia this year is nothing short of remarkable. For perspective, Miami has only reached 100F (38C) once on record.’

https://www.dailymail.co.uk/news/article-8444319/Arctic-records-hottest-temperature-mercury-hits-100F-town-Verkhoyansk-Siberia.html?login#readerCommentsCommand-message-field


Even the babies who write for the Mail could surely spot the fly in the ointment – that this new record is only 0.4F higher than the previous one set in 1915! Hardly the apocalypse they are trying to present.

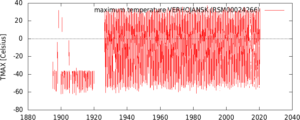
As for Verkhoyansk itself, temperatures there reached 37.3C (99.1F) in 1988 during a succession of 30C+ days, so again there is nothing remarkable about the latest weather at all :

A HISTORY OF THE ADVANCE AND RETREAT OF ALPINE GLACIERS

by Cap Allon, June 23, 2020 in Electroverse


It should be obvious after watching that glacial advances and retreats have always occurred and that they must therefore be the result of natural forcings.

On the back of decades of historically high solar activity, modern human’s witnessed a gradual glacial melt. But now, the Sun is once again shutting down, and the evidence for a return to glacial advance is ever-building:

The Greenland Ice Sheet continues to gain record amounts of snow & ice:


What Happened To Greenland’s Tipping Point?

by P. Homewood, June 22, 2020 in NotaLotofPeopleKnowThat


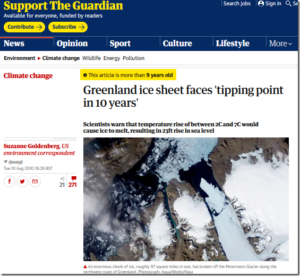
Ten years ago, the Guardian warned us that Greenland would have passed a tipping point by now, with the whole ice sheet due to disappear by the end of the century:

How did that work out then?

The article was written in 2010, which was the warmest on record. Since then, however, Greenland’s temperatures have returned to normal, and are no higher than they were in the 1930s.

Far from being the start of a new trend, 2010 was simply an outlier: