Archives par mot-clé : Melting

Another Tipping Point Cancelled—Claims Of Runaway Greenland Ice Melt Overblown

by  Klimanachrichten, Oct 23,2023 in ClimateChangeDispatch


We have carefully read the definition of a “tipping point” as conveyed by the Potsdam Institute (PIK):

“It’s like a pencil that you push further and further over the edge of a table with your finger. First nothing happens – then it falls.” That’s what the PIK website says.

Nothing can bring the pencil back to the table except a failure of gravity, which is not conceivable. [emphasis, links added]

Then PIK lists various “elements” that are supposed to exhibit such behavior. To the Greenland Ice Sheet (GrIS), one finds:

There are indications that the tipping point, which leads to an almost complete loss of ice in the long term (about 10,000 years), could probably be reached at a global warming of just under 1.5°C (possible from 0.8°C global warming, at the latest at 3°C).“

Now there’s a paper on the subject that has appeared in “Nature“, which paints a different picture. It finds that even after a possibly “critical warming threshold” has been crossed, “the pencil does not fall down”:

We find several stable intermediate ice-sheet configurations … that return to the present-day state if the climate returns to present-day conditions.”

In addition, models often determine the warming in Greenland (the root of the evil) using the mean global warming rate and then apply an “Arctic amplification” factor to each warming to determine the temperature swing in Greenland.

The paper states:

Recently, it has been shown that the Arctic warms four times faster than the global average and thus substantially exceeds previous estimates and projections from climate models.

Arctic amplification of this magnitude would reduce the safe space for the GrIS substantially. However, surface temperatures around Greenland might not increase that severely in the future.

Observations since 2000 now show that during this period, the warming of the Arctic is far from uniform:

“RUN AWAY MELTING” IS AN IPCC EMBARRASSMENT; -23C (-9.4F) IN SWEDEN; + NORWEGIAN STATISTICS BUREAU COUNTERS GLOBAL WARMING HYSTERIA

by Cap Allon, Oct 23, 2023 in Electroverse


“RUN AWAY MELTING” IS AN IPCC EMBARRASSMENT

It’s been over 15-years since the release of the IPCC’s AR4 report which called for “run away melting” of Arctic sea ice. This bold proclamation, devised from a baseless extrapolating of a few ‘bad’ years, will be the ruin of the agency.

….

See also: Greenland’s Tipping Point Cancelled? Claims Of A Runaway Melt Are Overblown

17 years of near-zero trend in September sea ice demolishes claim that more CO2 means less sea ice

by Polar Bear Science, Sep  23, 2023


If the hottest year ever can’t precipitate ‘ice-free’ conditions in September, what’s it going to take? Arctic sea ice failed to nose-dive again this year, undoubtedly disappointing expects who have been anticipating a ‘death-spiral’ decline for ages. Arctic sea ice hit its seasonal low sometime around mid-September this year and although the precise value hasn’t been published, the average September ice coverage will likely be about 4.2 mkm2 once it gets announced in early October.

This means we have now had 17 years of a near-zero trend for September sea ice, extending the nearly-flat trend NSIDC sea ice experts acknowledged four years ago. This surely busts a huge hole in the prevailing concept that more atmospheric CO2 causes less summer sea ice. Note that CO2 levels measured in August 2023 were 419.7 parts per million (ppm), compared to 382.2 in August 2007, a rise of 37.5ppm with no corresponding decline in summer sea ice (and vs. 314.2 ppm in 1960). Measured in metric tons, CO2 emissions due to fossil fuels rose from 31.1 billion in 2007 to 37.1 billion in 2021 (last year of data), again with no corresponding decline in summer sea ice.

Background

Arctic 2023 Refuses To Melt…German Scientists Blame ‘Unusual Weather’

by P. Gosselin, Sep 17, 2023 in ClimateChangeDispatch


Sixteen Years Of No Decline

Arctic summer minimum sea ice extent refuses to drop further, surprising and frustrating the alarmist media.

German research vessel Polarstern of the Alfred Wegener Institute (AWI) is currently underway again in the Arctic where a decrease in sea ice had been expected there, or, probably more accurately said, hoped for. [emphasis, links added]

But this year the minimum Arctic sea ice extent has turned out differently, as Germany’s widely viewed (climate-alarmist) Tagesschau news had to report:

In view of the extreme summer, the question arose in advance: Will the Arctic also see a new negative record in melting ice this year? This time, the Arctic has been spared.

AWI director and expedition leader Antje Boetius tells Tagesschau that an unusual weather phenomenon prevented a record melt of Arctic sea ice this summer.

According to Boetius, a sequence of low-pressure systems has led to an entirely different ice movement. The so-called transpolar drift, which describes the drifting of ice along certain routes, took a different course this year, she said.

Ice from the Siberian region has been held together and compressed instead of drifting out and melting. For the AWI director, this shows that weather phenomena determine the development of sea ice, and that forecasting is more difficult than ever.

The Arctic, with its sea ice and life, has been lucky once again, says the biologist. But things could go the other way. “If we are unlucky, if weather phenomena play unfavorably, we can also be affected by large ice-free parts much sooner than expected,” Boetius adds.”

We notice that when the opposite happens, e.g. heat, storms, or more ice melt, then it’s all because of climate warming. But when it goes the other way, then it’s weather!

Study Claims Ice Sheet Melt After Last Ice Age Faster Than Expected, Sans SUV

by E. Utter, Apt 11, 2023 in ClimateChangeDispatch


According to a recently released study, at the end of the last ice age, parts of an enormous ice sheet covering Eurasia retreated up to 2,000 feet per day.

That rate is the fastest measured to date, far exceeding what scientists previously believed to be the upper limits for ice sheet retreat. [emphasis, links added]

In the new study, lead author Christine Batchelor and her colleagues analyzed former beds of two major ice streams across the Norwegian continental ice shelf dating back 15,000 to 19,000 years ago.

Using ship-borne imagery, the team then calculated the rates of retreat by studying patterns of wavelike ridges along the seafloor.

They hypothesized that the “orderly” ridge patterns they observed may have been created as the front of the glacier bounced on the seafloor from daily tides.

Call me a skeptic, but this doesn’t sound to me like “settled science.”

Nonetheless, Batchelor and crew think the finding may shed light on how quickly ice in Greenland and Antarctica might melt — and raise global sea levels — in a warming world.

Batchelor stated: “If temperatures continue to rise, then we might have the ice being melted and thinned from above as well as from below, so that could kind of end up with a scenario that looks more similar to what we had [off] Norway after the last glaciation.”

According to a story in The Washington Post, Eric Rignot, a glaciologist who was not involved in the study, opined on it anyway, stating via email:

This is not a model. This is real observation. And it is frankly scary. Even to me.” (Cue the voice of Elmer Fudd. “Yes, it is vewy, vewy, scawy, Rignot.” Not.

The only thing the study proves is that the Earth warmed quickly and dramatically eons agowithout any possible help from man.

Mountain glacier melting is linked to shifting westerlies and likely to accelerate

by University of Maine, Dec 13, 2022 in ScienceDaily 


The combination of global atmospheric warming and westerly winds shifting toward the poles will likely speed up the recession of mountain glaciers in both hemispheres, according to a UMaine study.

Mountain glaciers freeze and gain mass when the climate cools, and melt and lose mass when the climate warms. The extent to which the fluctuations in mountain glaciers are reflective of local, regional and even hemispheric climate variations, however, is less clear, which has made it more difficult for scientists to use glacial data to interpret past climate dynamics and make predictions for the future.

A team of researchers from the University of Maine conducted a National Science Foundation-funded study evaluating how atmospheric conditions are reflected in the mass fluctuations of mid-latitude glaciers on opposite sides of the Earth, comparing global temperature and wind changes with glacier snowline elevations (also called “equilibrium-line altitudes”) in the Southern Alps of New Zealand and in the European Alps observed over the course of nearly four decades. Glacier extent is dependent on the height of the snowline in the atmosphere, below which ice melts, which in turn is determined by the temperature of the atmosphere.

The data showed that the fluctuations in glacial snowlines reflected temperature changes over large regions of the atmosphere for the two mountain systems studied — even on hemispheric scales. Moreover, the latitudes of westerly wind belts were found to be important for regulating the proportion of cold versus warm air masses that influence glacier melting and freezing.

New Study Affirms Anthropogenic CO2 Emissions Play No Role In Larsen Ice Shelf Melt

by K. Richard, Oct 3, 2022 in NoTricksZone


There are four main reasons why Antarctica’s Larsen C Ice Shelf may be melting. None of them involve human forcing or CO2 concentration changes.

Scientists have recently completed an exhaustive 20-year study of the “most significant causes of melting” of the Larsen C Ice Shelf in the Antarctic Peninsula. They have concluded the 4 main surface melt drivers are:

1. Shortwave solar radiation.

2. Foehn wind variations.

3. Cloud cover changes.

4. Natural circulation variations (SAM, ENSO).

Neither anthropogenic forcing nor CO2 emissions are listed as causal factors in Antarctic ice melt processes.


In other words, there is nothing even remotely unusual about any Antarctic ice melt or climate trends that cannot be explained by or attributed to natural, non-anthropogenic processes.

Al Gore’s 2009 Warning on Vanishing Polar Ice and the Perils of Censoring ‘Misinformation’

by J. Miltimore, Mar 17, 2022 in FEEStories


While speaking at a climate change summit in Denmark in 2009, former Vice President Al Gore made an alarming statement.

Citing research from Dr. Wieslaw Maslowski, a professor of oceanography at the Naval Postgraduate School in California, Mr. Gore said it was likely that the north polar ice caps would soon be completely melted.

“These figures are fresh,” Mr. Gore said. “Some of the models suggest to Dr. Maslowski that there is a 75 percent chance that the entire north polar ice cap, during the summer months, could be completely ice-free within five to seven years.”

Stalled: September Arctic Sea Remains Surprisingly Stable Over Past Decade, “Long Way From Predicted “Ice Free”

by P. Gosselin, Sept 10, 2021 in NoTricksZone


This year’s Arctic sea ice minimum reaches third highest level in a decade, latest data show.

Die kalte Sonne here presents its latest climate video. The first part looks at this year’s Arctic sea ice melt season. Now that it’s September, sea ice extent has just about reached its minimum for the year and soon the annual refreeze will begin.

We recall that years ago alarmist scientists and wacko activists, like al Gore, predicted an ice free Arctic by now. Today we look at the most recent data and we see that we are a very long way from that point.

Very slow August melt this year

What follows is the chart from the National Snow and Ice Data Center (NSIDC):

Claim: Melting glaciers contribute to Alaska earthquakes

by UNIVERSITY OF ALASKA FAIRBANKS, March 15, 2021 in WUWT


In 1958, a magnitude 7.8 earthquake triggered a rockslide into Southeast Alaska’s Lituya Bay, creating a tsunami that ran 1,700 feet up a mountainside before racing out to sea.

Researchers now think the region’s widespread loss of glacier ice helped set the stage for the quake.

In a recently published research article, scientists with the University of Alaska Fairbanks Geophysical Institute found that ice loss near Glacier Bay National Park has influenced the timing and location of earthquakes with a magnitude of 5.0 or greater in the area during the past century.

Scientists have known for decades that melting glaciers have caused earthquakes in otherwise tectonically stable regions, such as Canada’s interior and Scandinavia. In Alaska, this pattern has been harder to detect, as earthquakes are common in the southern part of the state.

Alaska has some of the world’s largest glaciers, which can be thousands of feet thick and cover hundreds of square miles. The ice’s weight causes the land beneath it to sink, and, when a glacier melts, the ground springs back like a sponge.

“There are two components to the uplift,” said Chris Rollins, the study’s lead author who conducted the research while at the Geophysical Institute. “There’s what’s called the ‘elastic effect,’ which is when the earth instantly springs back up after an ice mass is removed. Then there’s the prolonged effect from the mantle flowing back upwards under the vacated space.”

In the study, researchers link the expanding movement of the mantle with large earthquakes across Southeast Alaska, where glaciers have been melting for over 200 years. More than 1,200 cubic miles of ice have been lost.

Southern Alaska sits at the boundary between the continental North American plate and the Pacific Plate. They grind past each other at about two inches per year — roughly twice the rate of the San Andreas fault in California — resulting in frequent earthquakes.

….

End of Snow? Finland Thinks Their Winter Snow Might Not Melt This Summer

by Eric Worall, March 22, 2021 in WUWT


Finland thinks that piles of snow accumulated from road clearing this year are so large, some of the snow will still be frozen when winter returns.

In Finnish capital region, snow piles built up this winter may not melt during summer

FINLAND  15 MARCH 2021

THE CAPITAL REGION of Finland has received so much snow this winter that the metres-high piles hauled to designated snow dump areas may not melt during the course of the summer, reports Helsingin Sanomat.

In Uusimaa, for example, the amount of snow was 1.7 times higher than last year in January, according to Foreca.

Helsingin Sanomat on Friday wrote that the piles of snow stand almost as high as 20 metres at the dump area in Herttoniemi, eastern Helsinki. In Maununneva, a north-western neighbourhood of the city, lorries have dumped roughly 16,000 loads of snow at the dump area, revealed Tero Koppinen, a production manager at Helsinki City Construction Services (Stara).

The snow ploughed from roads forms a large structure, nicknamed by the locals as the Alps, also at the only snow dump area in Espoo, in Vanttila.

Read more: https://www.helsinkitimes.fi/finland/finland-news/domestic/18867-snow-piles-built-up-this-winter-may-not-melt-during-summer-in-finnish-capital-region.html

The Fins mostly seem to be treating this as a joke, maybe a chance to cool off on warm Summer days. And most likely this event will have no long term consequences.

But history teaches that when ice ages strike, they can strike abruptly, with very little warning.

12,800 years ago, the world abruptly froze. Temperatures plunged back to ice age conditions, and stayed cold for over 1000 years.

Ocean forcing drives glacier retreat in Greenland

by M. Wood et al., Jan 01, 2021 in AAAS OPEN ACCESS


INTRODUCTION

The Greenland Ice Sheet has contributed substantially to sea-level rise over the past few decades. Since 1972, approximately two-thirds of the ice sheet’s contribution to sea-level rise resulted from increased glacier flux with the remaining one-third from anomalous surface melt (1). Before 2000, anomalous ice discharge was the dominant driver of mass loss, but in recent years, increasingly negative surface mass balance anomalies have contributed to a larger proportion of the total mass loss from the ice sheet (1). The acceleration in mass flux has been partially attributed to a warming of subsurface waters around Greenland near the end of the 1990s (2, 3) and increased runoff, resulting in enhanced water mixing and melt at glacier margins, destabilization of terminus regions (4, 5), ice front retreat (6, 7), and, in most cases, accelerated ice flow (8). The increase in flow speed, combined with enhanced surface melt, results in increased glacier thinning, which is conducive to further retreat (9). Other processes may have additionally contributed to the glacier retreat, e.g., increases in basal lubrication, melting of the ice mélange in front of glaciers, or weakening of glacier shear margins, but quantitative evidence about their impact has been limited (1012).

The warming of subsurface waters at the turn of the 21st century was caused by the spreading of ocean heat from the subpolar gyre during a transition in the North Atlantic Oscillation (NAO) from a high positive phase to a low-to-negative phase (3). In this shift, the North Atlantic subpolar gyre expanded, enhancing ocean heat fluxes through the coastal Irminger and West Greenland currents, yielding warmer subsurface waters on the continental shelf of all seven major basins of Greenland (Fig. 1). Since 2010, the NAO has transitioned back to a more positive phase, yielding a relative cooling of the ocean waters, however, not sufficiently to bring back ocean heat fluxes to the levels of the 1990s (13).

How to Scare and Deceive without Lying: JPL Cries Wolf about Polar Glacial Melt

by C. Beisner, Nov 6, 2020 in WUWT


Yesterday NASA’s Jet Propulsion Laboratory published “The Anatomy of Glacial Ice Loss.” For the most part it’s an interesting, though not particularly revolutionary, discussion of the various forces that add to and subtract from glacial ice. Nothing wrong with that.

But its authors took the opportunity to insert a poison pill, a little bit of fearmongering, in a video caption:

Did you catch that little trick? “Combined, the two regions also contain enough ice, that if it were to melt all at once, would raise sea levels by nearly 215 feet ….”

Well, yes, but at what rate is the ice from the two regions melting, and at what rate can we, with any confidence, predict they’ll continue to melt, and over what period of time?

There is absolutely no chance of their melting “all at once”—barring, I suppose, Earth’s collision with some enormous asteroid that sends Earth careening into the Sun!

So, how fast is the ice melting?

For Greenland, about 0.1% of its ice mass per decade—1 percent per century.

For Antarctica, about 0.0045% per decade—1% in 2,200 years.

Combined, those contribute to sea-level rise of about 1 mm per year, i.e., 3.94 inches per century.

(See “Lying with Statistics: The National Climate Assessment Falsely Hypes Ice Loss in Greenland and Antarctica.”)

So, if the actual rate is about 3.94 inches (0.3283 foot) per century, how long would it take to raise sea level by 215 feet? The answer: 215 ft. / 0.3283 ft. per century = 654.889 centuries, or 65,488.9 years.

Claim: Past evidence supports complete loss of Arctic sea-ice by 2035

by BRITISH ANTARCTIC SURVEY, August 3, 2020 in WUWT/Ch. Rotter


A new study, published this week in the journal Nature Climate Change, supports predictions that the Arctic could be free of sea ice by 2035.

BRITISH ANTARCTIC SURVEY

A new study, published this week in the journal Nature Climate Change, supports predictions that the Arctic could be free of sea ice by 2035.

High temperatures in the Arctic during the last interglacial – the warm period around 127,000 years ago – have puzzled scientists for decades. Now the UK Met Office’s Hadley Centre climate model has enabled an international team of researchers to compare Arctic sea ice conditions during the last interglacial with present day. Their findings are important for improving predictions of future sea ice change.

During spring and early summer, shallow pools of water form on the surface of Arctic sea-ice. These ‘melt ponds’ are important for how much sunlight is absorbed by the ice and how much is reflected back into space. The new Hadley Centre model is the UK’s most advanced physical representation of the Earth’s climate and a critical tool for climate research and incorporates sea-ice and melt ponds.

Using the model to look at Arctic sea ice during the last interglacial, the team concludes that the impact of intense springtime sunshine created many melt ponds, which played a crucial role in sea-ice melt. A simulation of the future using the same model indicates that the Arctic may become sea ice-free by 2035.

Joint lead author Dr Maria Vittoria Guarino, Earth System Modeller at British Antarctic Survey (BAS), says:

“High temperatures in the Arctic have puzzled scientists for decades. …

A snapshot of melting Arctic sea ice during the summer of 2018

by C. Rotter, July 30, 2020 in WUWT


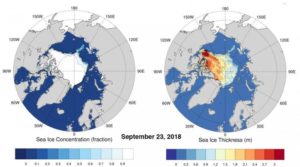
IMAGE: THIS FIGURE SHOWS THE SEA ICE CONCENTRATION AND THICKNESS IN THE ARCTIC ON SEPTEMBER 23RD 2018. view more CREDIT: JUHI YADAV

As sea ice in the Arctic retreats further and melts faster every decade, scientists are racing to understand the vulnerabilities of one of the world’s most remote and unforgiving places. A study appearing July 29 in the journal Heliyon details the changes that occurred in the Arctic in September of 2018, a year when nearly 10 million kilometers of sea ice were lost over the course of the summer. Their findings give an overview at different timescales of how sea ice has receded over the 40 years of the satellite era and show how the summer’s extensive decline is linked to global atmospheric processes as far south as the tropics.

At the peak of its melting season, in July 2018, the Arctic was losing sea ice at a rate of 105,500 square kilometers per day–an area bigger than Iceland or the state of Kentucky. “On the ground, I am sure it would have looked like an excellent summer month in the Arctic, in general, but over the past four decades, September sea-ice loss has accelerated to a rate of 12.8% per decade and 82,300 square kilometers per year,” says co-author Avinash Kumar, a senior scientist at the National Centre for Polar and Ocean Research (NCPOR) in India.

Melting Glaciers Uncover Medieval Artefacts In Norway

by P. Homewood, April 16, 2020 in NotaLotofPeopleKnowThat


Melting glaciers in Norway have revealed ancient artefacts dropped by the side of a road more than 1,000 years ago.

Clothes, tools, equipment and animal bone have been found by a team at a lost mountain pass at Lendbreen in Norway’s mountainous region.

A haul of more than 100 artefacts at the site includes horseshoes, a wooden whisk, a walking stick, a wooden needle, a mitten and a small iron knife.

The team also found the frozen skull of an unlucky horse used to carry loads that did not make it over the ice.

The objects that were contained in ice reveal that the pass was used in the Iron Age, from around AD 300 until the 14th century.

Activity on the pass peaked around AD 1000 and declined after the black death in the 1300s, due as well to economic and climate factors.

The researchers say the melting of mountain glaciers due to climate change has revealed the historical objects, with many more to come.

https://www.dailymail.co.uk/sciencetech/article-8224817/Melting-ice-reveals-lost-Viking-mountain-path.html


Unfortunately neither the journalist nor the scientists seem to be capable of adding 2+2!


The existence of the Medieval Warm Period in Norway, followed by glacial advance in the Little Ice Age has been long known about, as HH Lamb wrote in 1982:

Denman Glacier–Latest Antarctic Meltdown Scare

by P. Homewood, March 24, 2020 in NotaLotofPeopleKnowThat


Scientists have found a new point of major vulnerability in the Antarctic ice sheet, in a region that already appears to be changing as the climate warms and has the potential to raise sea levels by nearly five feet over the long term.

Denman glacier, in East Antarctica, is a 12-mile-wide stream of ice that flows over the deepest undersea canyon in the entire ice sheet before spilling out into the ocean. That subsea trough is more than 2 miles deep, or double the average depth of the Grand Canyon. While there are far deeper trenches in the open ocean, such as the Marianas Trench, in this case the extreme undersea topography lies right on the outer fringe of the Antarctic continent — making it the “deepest continental point on Earth.”

In reality the scientists who wrote this study do not have a clue whether the retreat of the Denman is anything new or not, or whether the deep ocean temperatures are any warmer than before 1979. Or whether what they are observing is just a natural process.


We can then go on to explore sea level implications.

They claim that since 1979, 250 billion tonnes of ice has been lost, equivalent to 0.5mm of sea level rise. In other words, 1.3mm/C, hardly cataclysmic.

They then go on to talk about a potential loss of 540 trillion tonnes, raising sea levels by 5 feet. Yet at current rates, it would take 86400 years for this to occur!

As always with these sort of studies, the authors refuse to say how long all this will take to happen.


Comprehensive Data, Recent Studies In Top Journals: Antarctica Stable, Temps Falling, Ice Mass Growing!

by P. Gosselin, January 14, 2020 in NoTricksZone


The ice in Antarctica, how is it doing? Is it melting, is it growing? In the following we wishto present the latest literature on the subject. There is a lot to report.

Fasten your seat belt, there’s a lot to cover.

Let’s start with the temperature development because along with snowfall, this is the most important control factor for Antarctic inland ice.

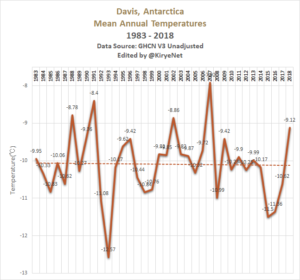
At NoTricksZone, Kirye shows ten coastal stations of Antarctica. None have been warming over the past 10 years. An example follows:


And here’s the temperature development of the entire Antarctic according to UAH and RSS satellite measurements (from Climate4You, via NoTricksZone):

Greenland Ice sheet Meltdown Scare–Except It’s Not True

by P.  Homewood,  August 1, 2019 in NotaLotofPeopleKnowThat


The same heat dome that roasted Europe and broke national temperature records in five countries last week has shifted to Greenland, where it is causing one of the biggest melt events ever observed on the fragile ice sheet.

By some measures, the ice melt is more extreme than during a benchmark record event in July 2012, according to scientists analyzing the latest data. During that event, about 98 percent of the ice sheet experienced some surface melting, speeding up the process of shedding ice into the ocean.

The fate of Greenland’s ice sheet is of critical importance to every coastal resident in the world, since Greenland is already the biggest contributor to modern-day sea level rise. The pace and extent of Greenland ice melt will help determine how high sea levels climb and how quickly….

The Danish Meteorological Institute tweeted that more than half the ice sheet experienced some degree of melting on Tuesday, according to a computer model simulation, which made it the “highest this year by some distance.”

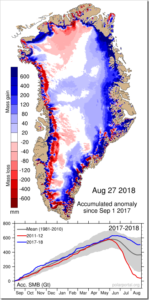
And there is no mention of the fact that the ice sheet grew substantially last year, and also the year before:

The simple fact is that the Greenland ice sheet melts every summer, particularly when the sun shines. That’s what it does. And it grows back again in winter as the snow falls. Indeed, if it did not melt, it would carry on growing year after year.

Inevitably there are some days when the weather is warmer and sunnier than normal, and others when it is colder. To pick an odd day or two is ridiculous and dishonest scaremongering.

See also here and here